AgencyAnalytics
AgencyAnalytics
  • Pricing
  • Login
  • Start Trial

Campaign Performance Dashboard for Live Data and Client Reporting

Monitor campaign performance in a fully customizable dashboard that consolidates insights from 80+ platforms. Track key metrics in one place, eliminate manual reporting, and provide clients with a live, transparent view of their marketing results.
Preview DashboardStart Your Free Trial
Campaign Performance Dashboard Template Example

Customizable Campaign Performance Dashboard for Smarter Insights

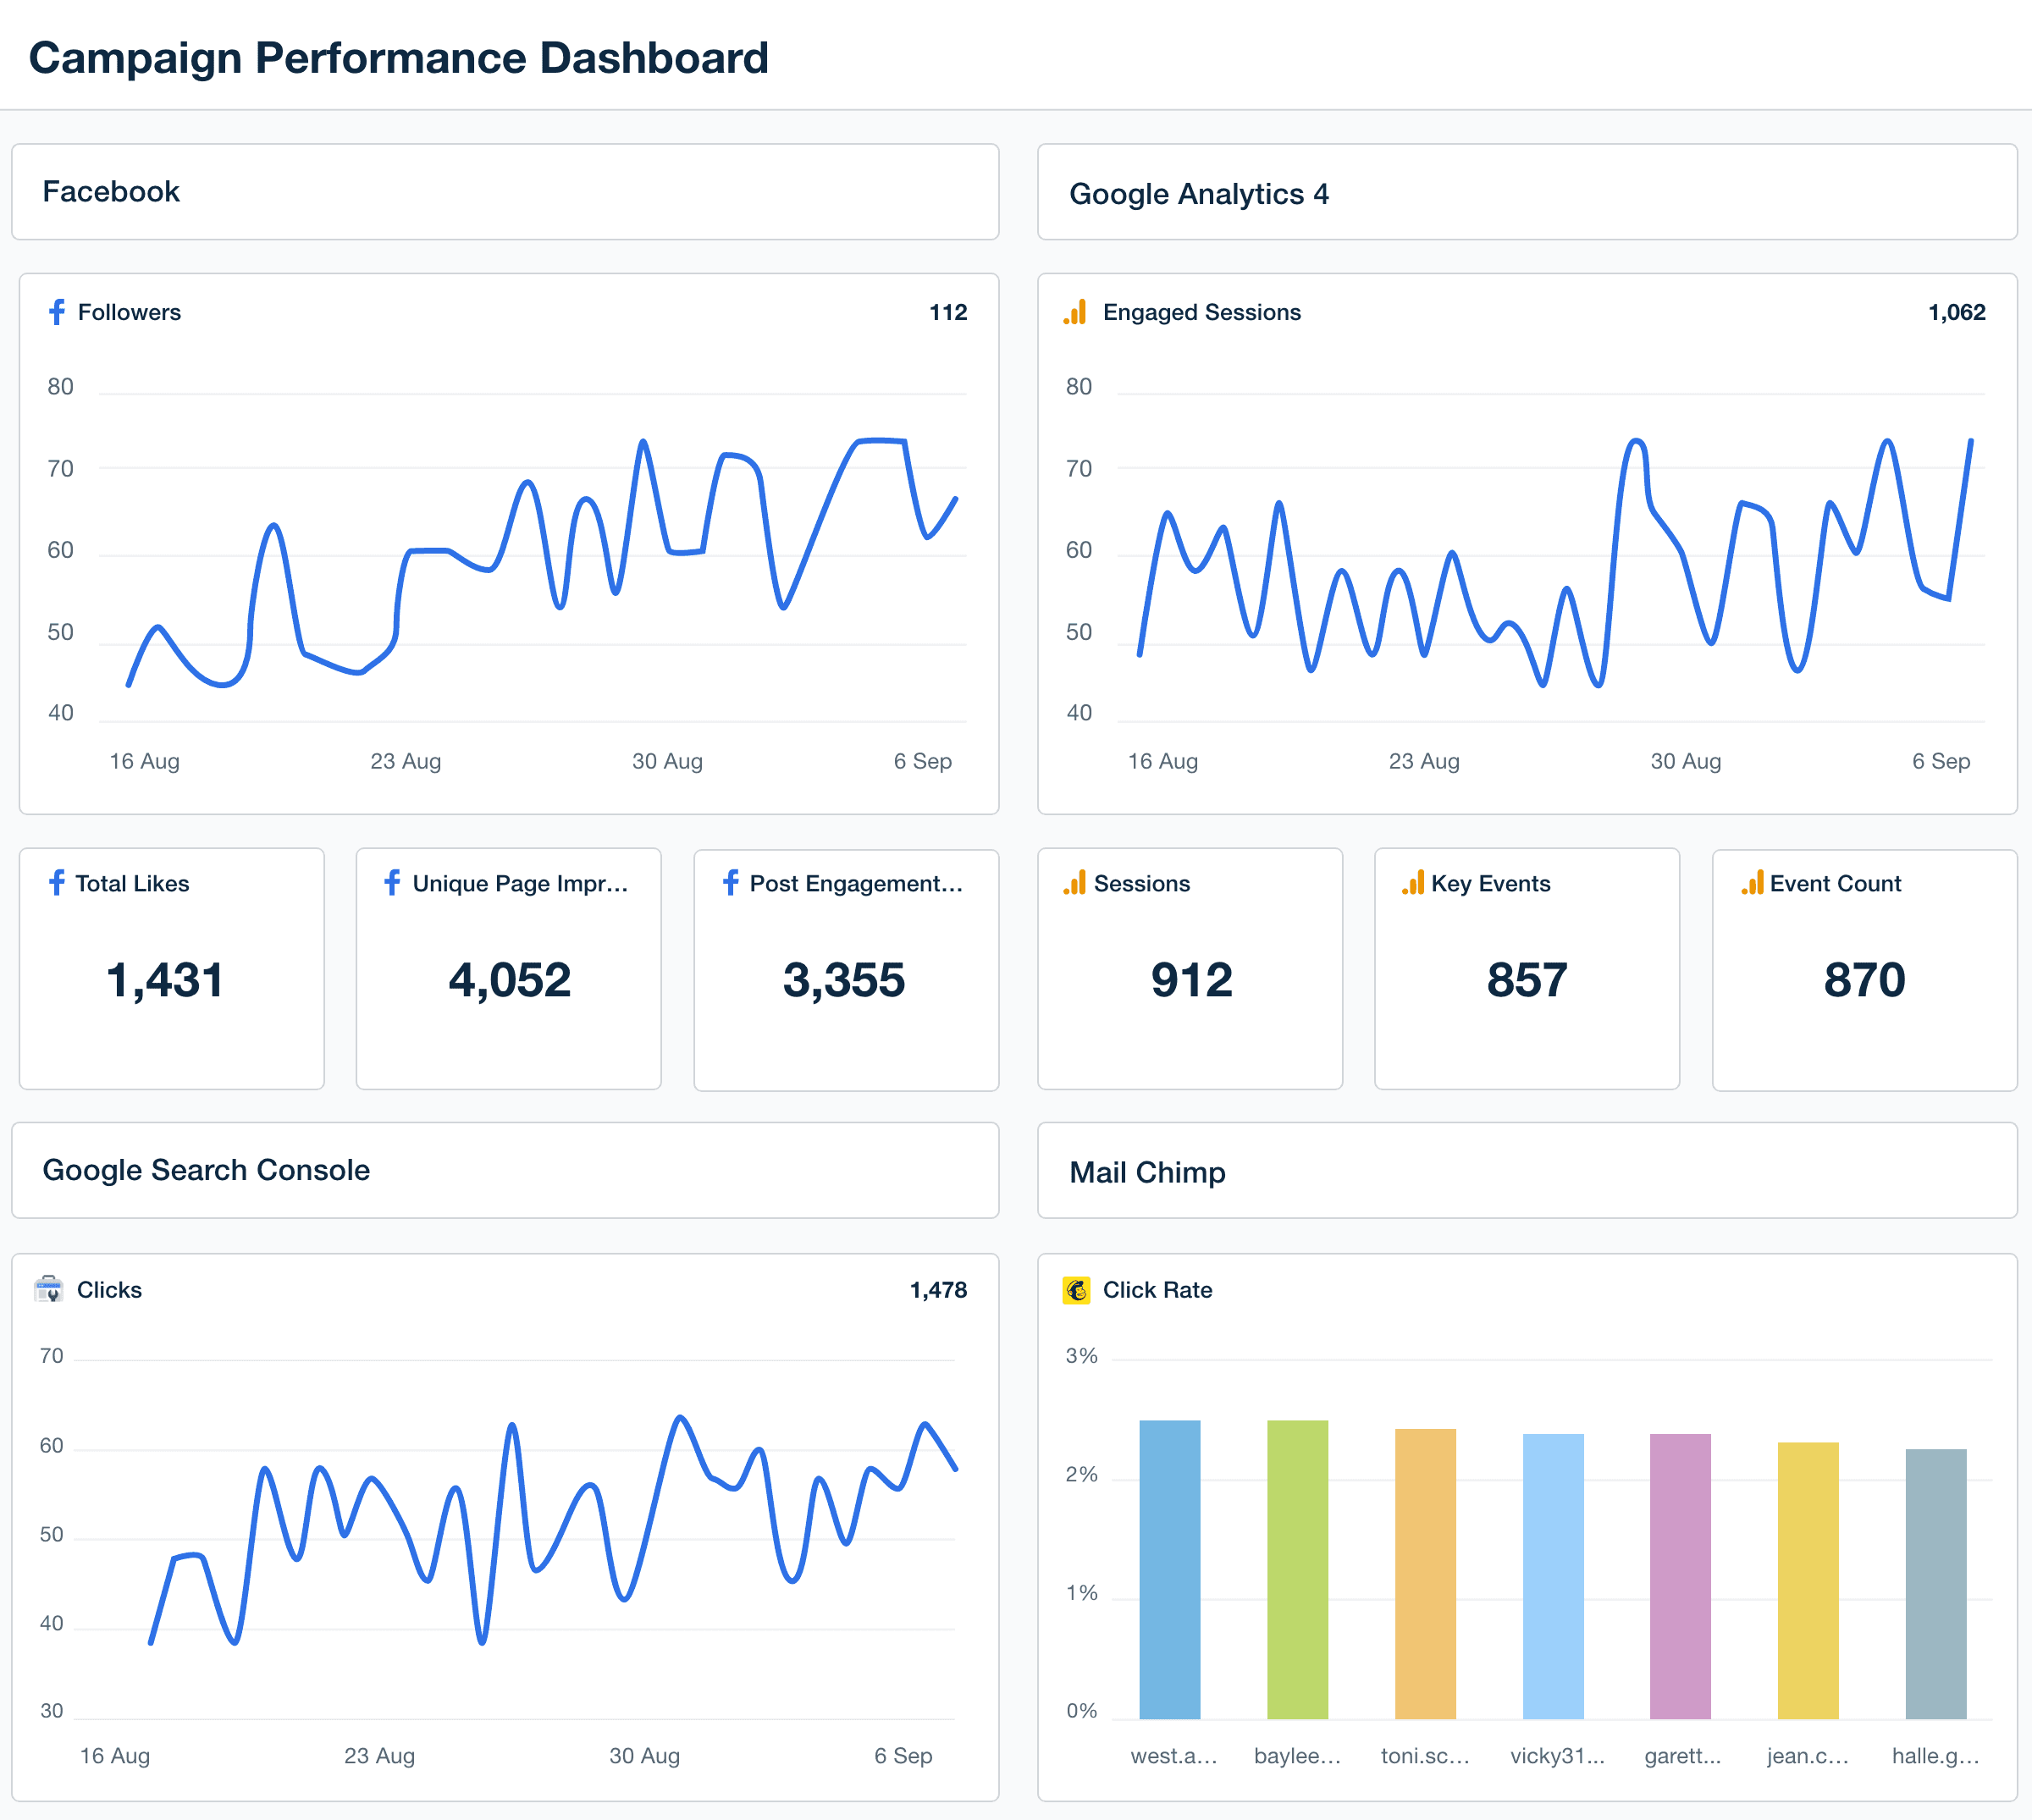
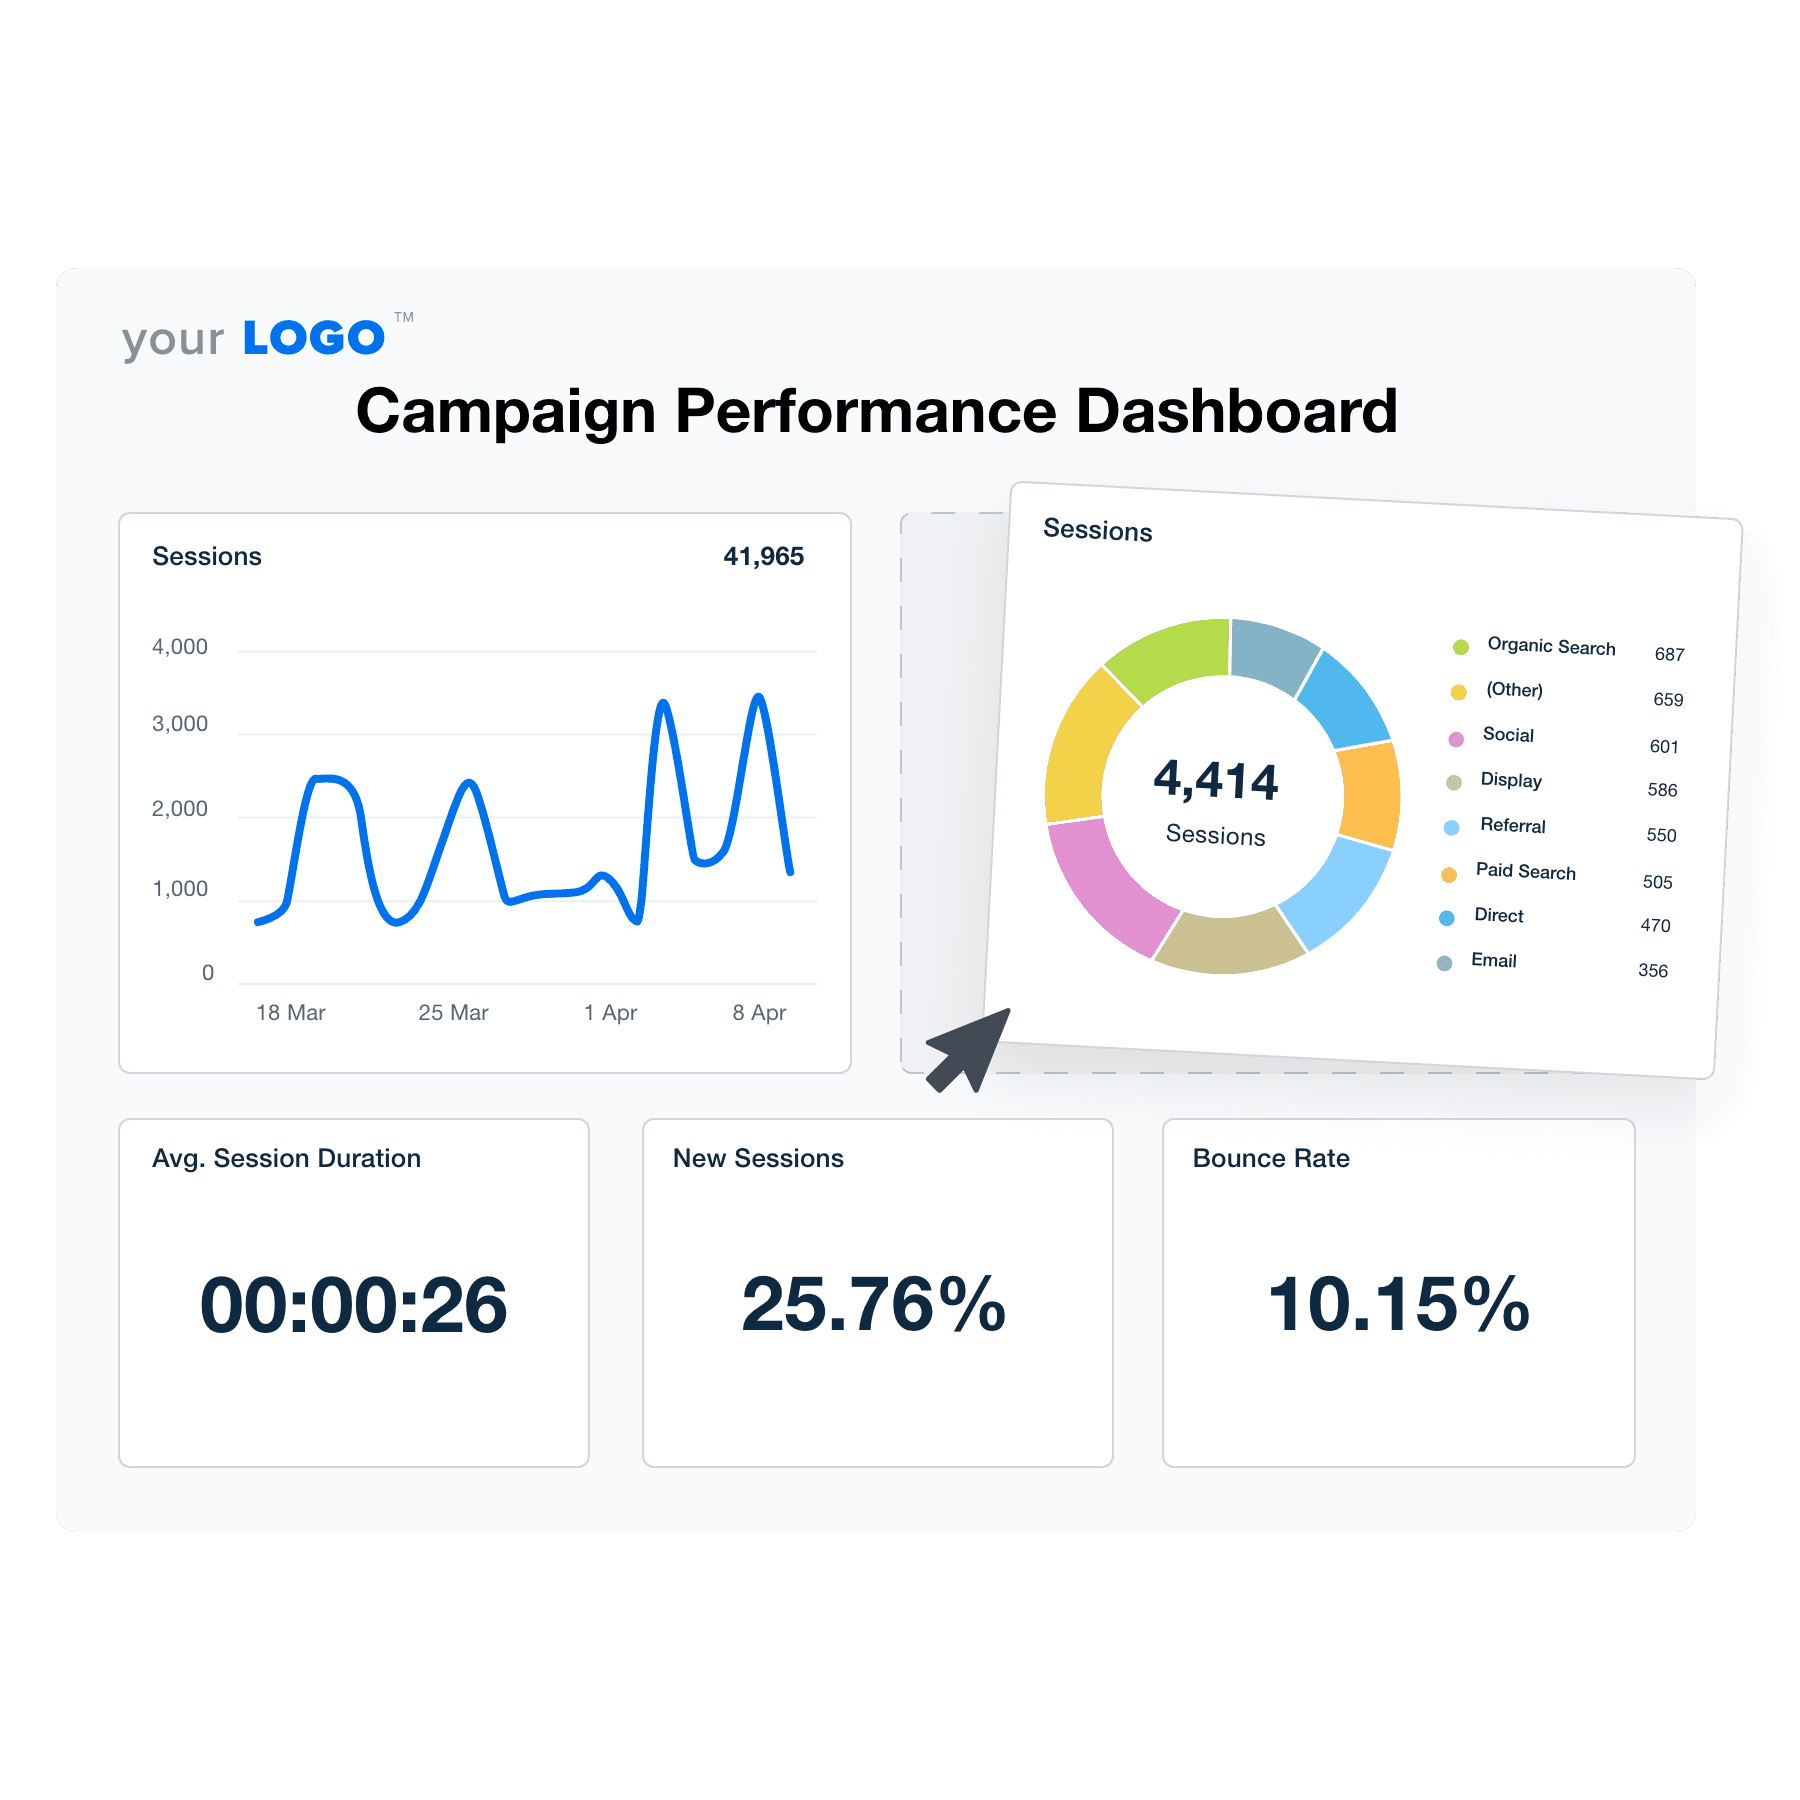
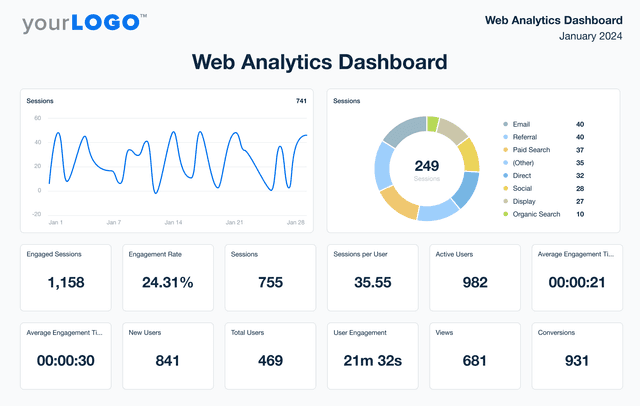
Create a white-labeled campaign performance dashboard that centralizes marketing data across SEO, PPC, social media, and web analytics. Customize widgets, white label the dashboards, and tailor data visualizations to showcase the most relevant KPIs.

Keep campaigns on track with live data while giving clients clear, up-to-date insights. With automated reporting and flexible customization, agencies save time and focus on optimizing performance instead of compiling reports.

Create Professional Campaign Dashboards in Minute
An illustration of the drag-and-drop campaign performance dashboard builder for marketing agencies
Create Professional Campaign Dashboards in Minute

Easily Report on All Your Campaigns

Start Your Free Trial

Campaign Performance Dashboards as Unique as Your Agency

Right At Your Fingertips

Instantly Access All Your Clients’ Campaign Performance Data

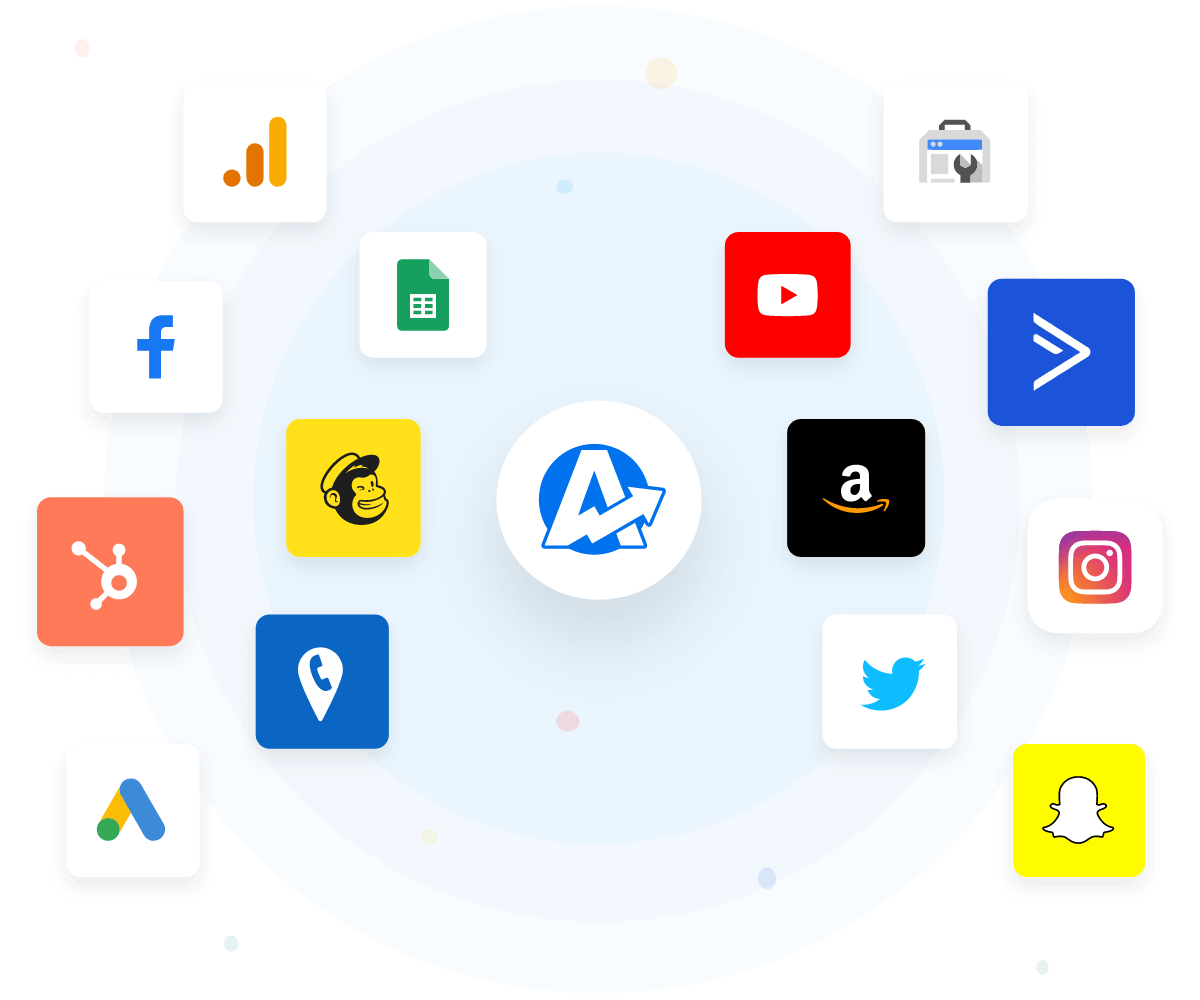
Manage multiple digital marketing campaigns without compromising service quality. AgencyAnalytics seamlessly integrates with 80+ marketing platforms, making it easy to deliver actionable insights that matter.

Access all your clients’ data in a single, unified hub. Analyze performance, identify optimization opportunities, and streamline the entire reporting process.

View All 80+ Integrations
An example of the available marketing platform integrations AgencyAnalytics offers to connect your clients' marketing data
View All 80+ Integrations
A Key Branding Touchpoint

White Label Your Marketing Performance Dashboard

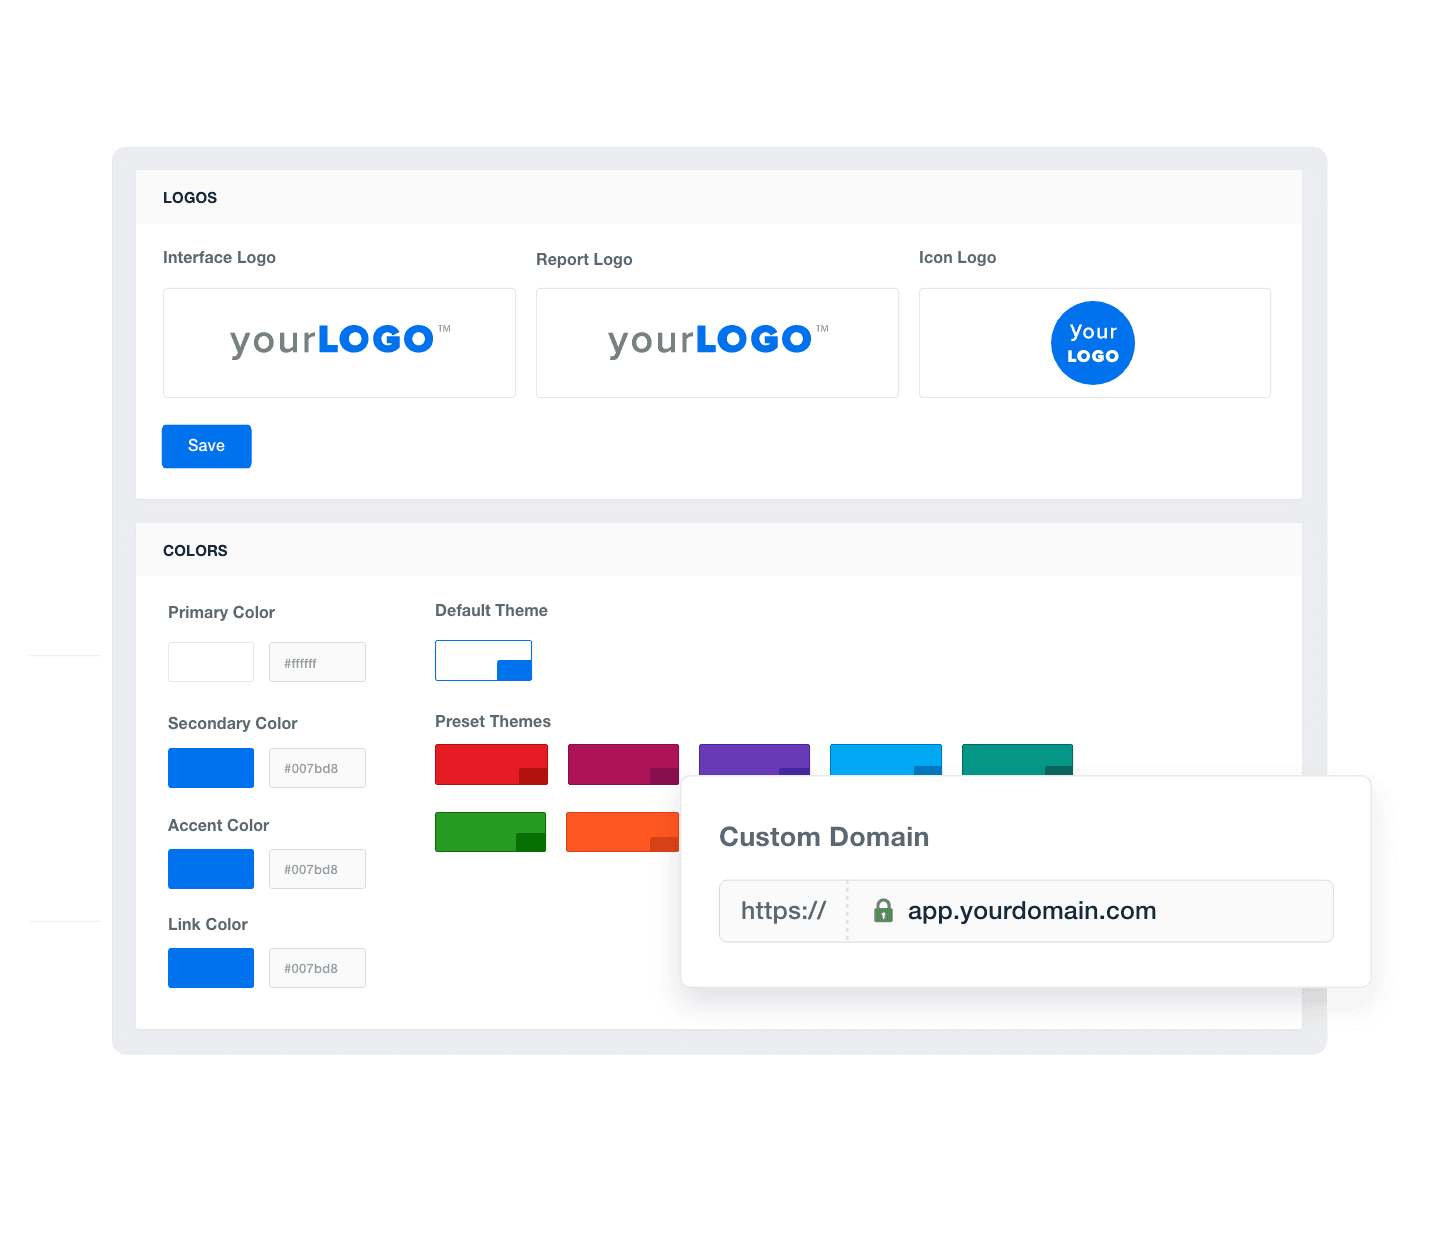
Elevate your agency's brand with the white label feature. Customize dashboards with your logo, colors, and messaging with a few clicks. Deliver a visually aesthetic, professional experience that reflects your unique identity.

Presentation matters. Build trust, add personalization, and demonstrate your attention to detail. Create a more memorable brand experience that sets your agency apart from the competition.

Add Your Agency's Branding
An example of how to add your marketing agency's branding to customizable marketing reporting software
Add Your Agency's Branding
A Tailored Approach

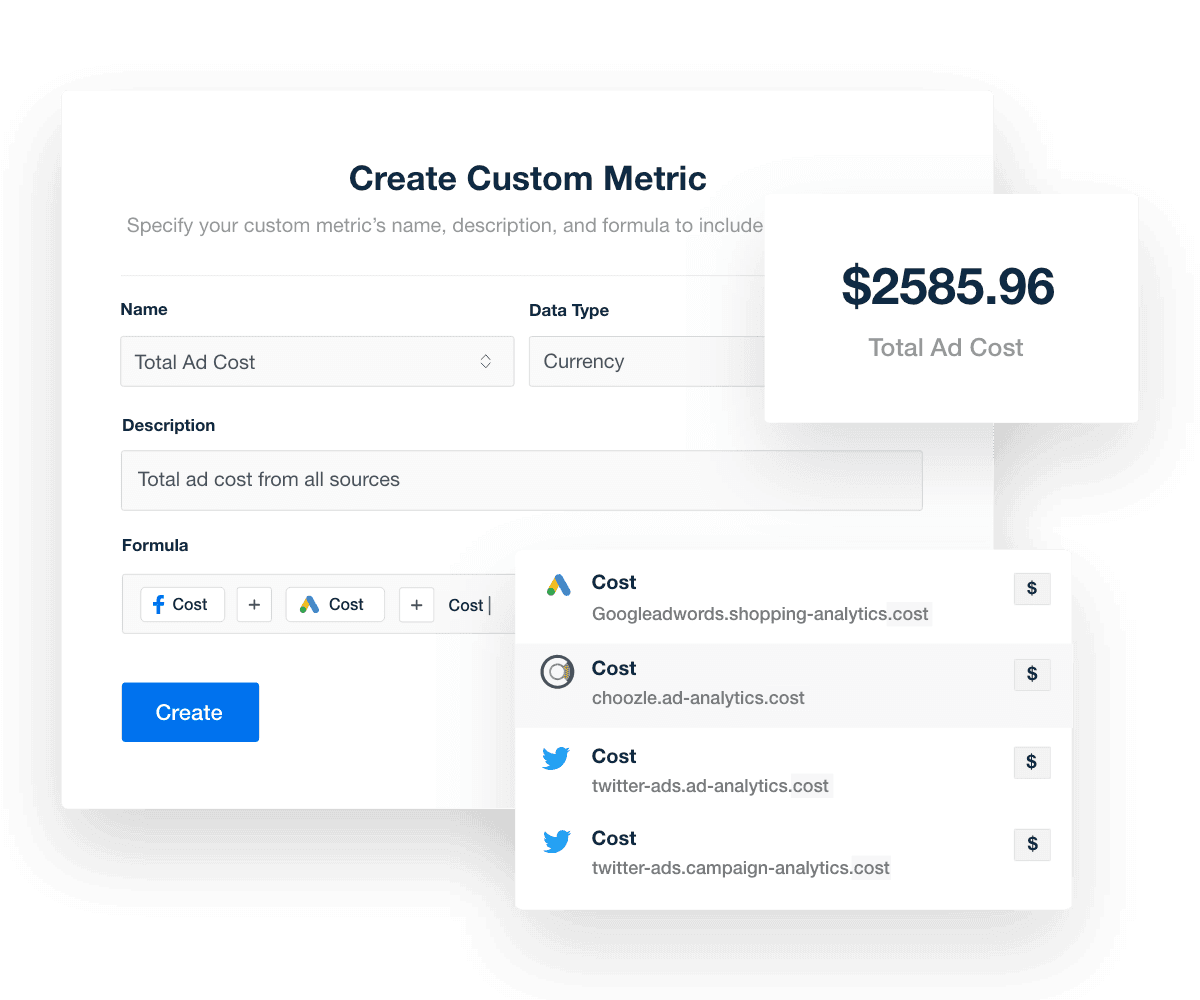
Provide Granular Insights With Custom Metrics

Dive deeper into performance analysis by blending data from 80+ integrations. With the custom metric feature, create unique formulas that align with your client’s specific goals. 

Go beyond generic insights. Present comprehensive reporting insights and drive better decision-making. Create a marketing analytics dashboard that delivers value and shows why you’re worth investing in.

Explore Custom Metrics
Create a Custom Metric
Explore Custom Metrics
Easily Track Marketing Performance

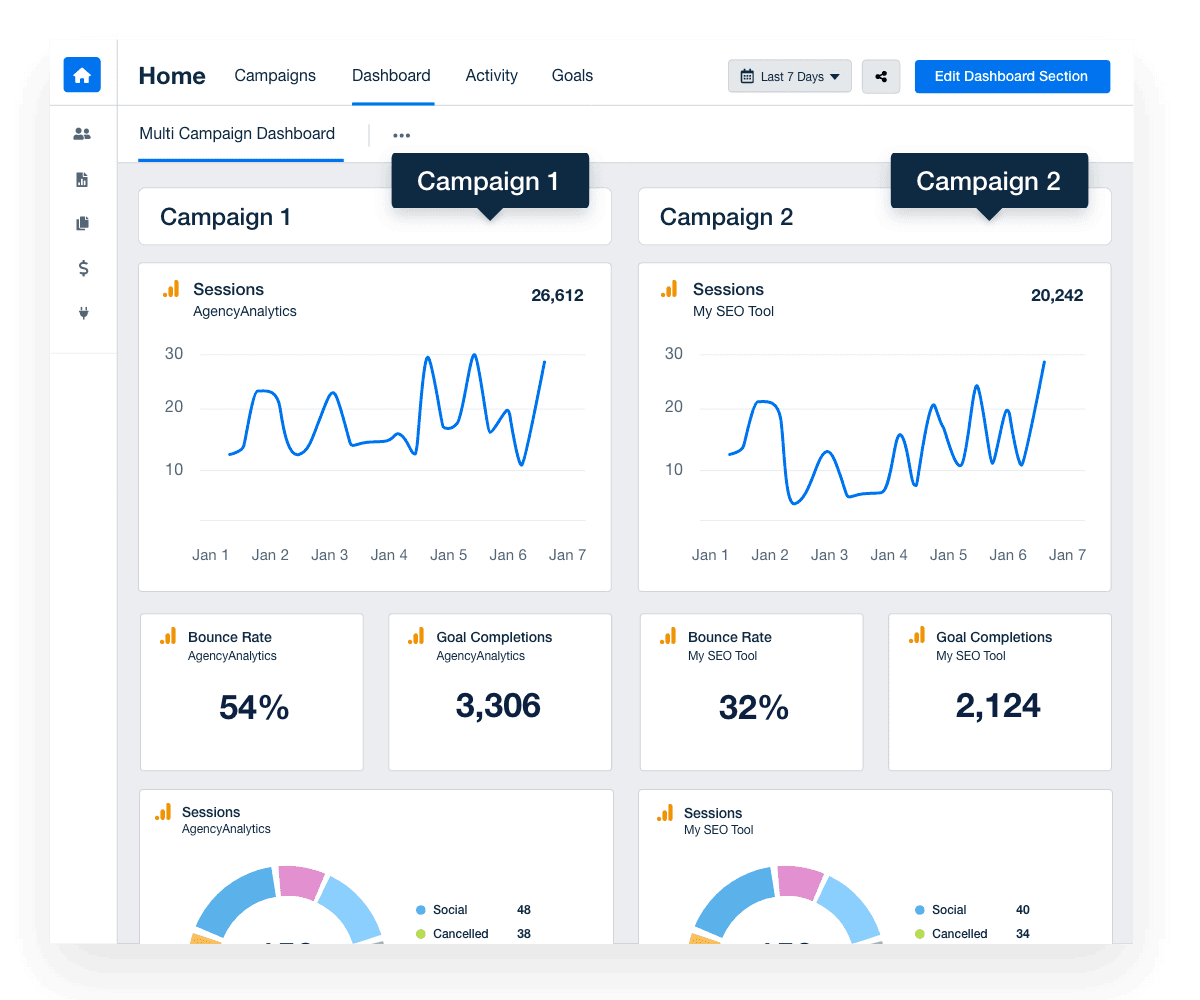
Monitor All of Your Clients at a Glance

Simplify your agency's workflow with account-level dashboards. Centralize key metrics from all client campaigns into a single, intuitive interface. Quickly track performance, identify trends, and optimize campaigns.

Get a bird’s eye view of marketing data with minimal hassle. Ensure that client accounts have enough visibility while reinforcing accountability within your marketing team.

Discover Multi-Client Dashboards
An Example of a Multi-Client Campaign Dashboard
Discover Multi-Client Dashboards
We’re Here To Help

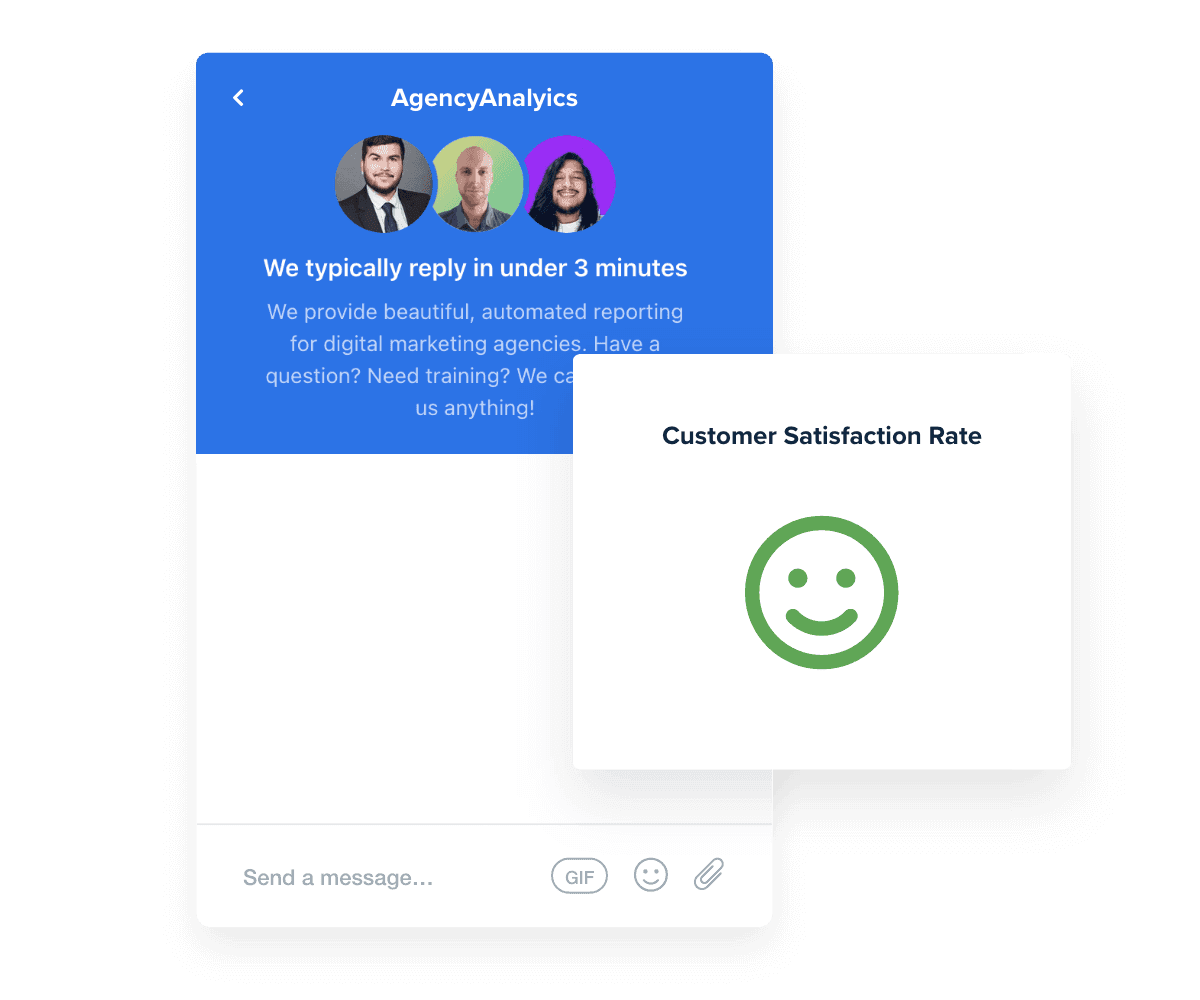
Customer Support is Our Top Priority

Need some extra help? Our live chat support team is here to assist 24/5, with response times less than three minutes on average. Whether it’s advice on tweaking a Google Ads dashboard or exporting a report, we’re here to answer your questions. 

Don’t take it from us–our customer satisfaction rate has consistently stayed above 95%. We're committed to providing unparalleled support that empowers your agency to thrive. You care about your clients’ success. We care about yours.

Read Reviews
Best in Class Customer Support for Marketing Agencies
Read Reviews
Give Your Agency Time To Grow

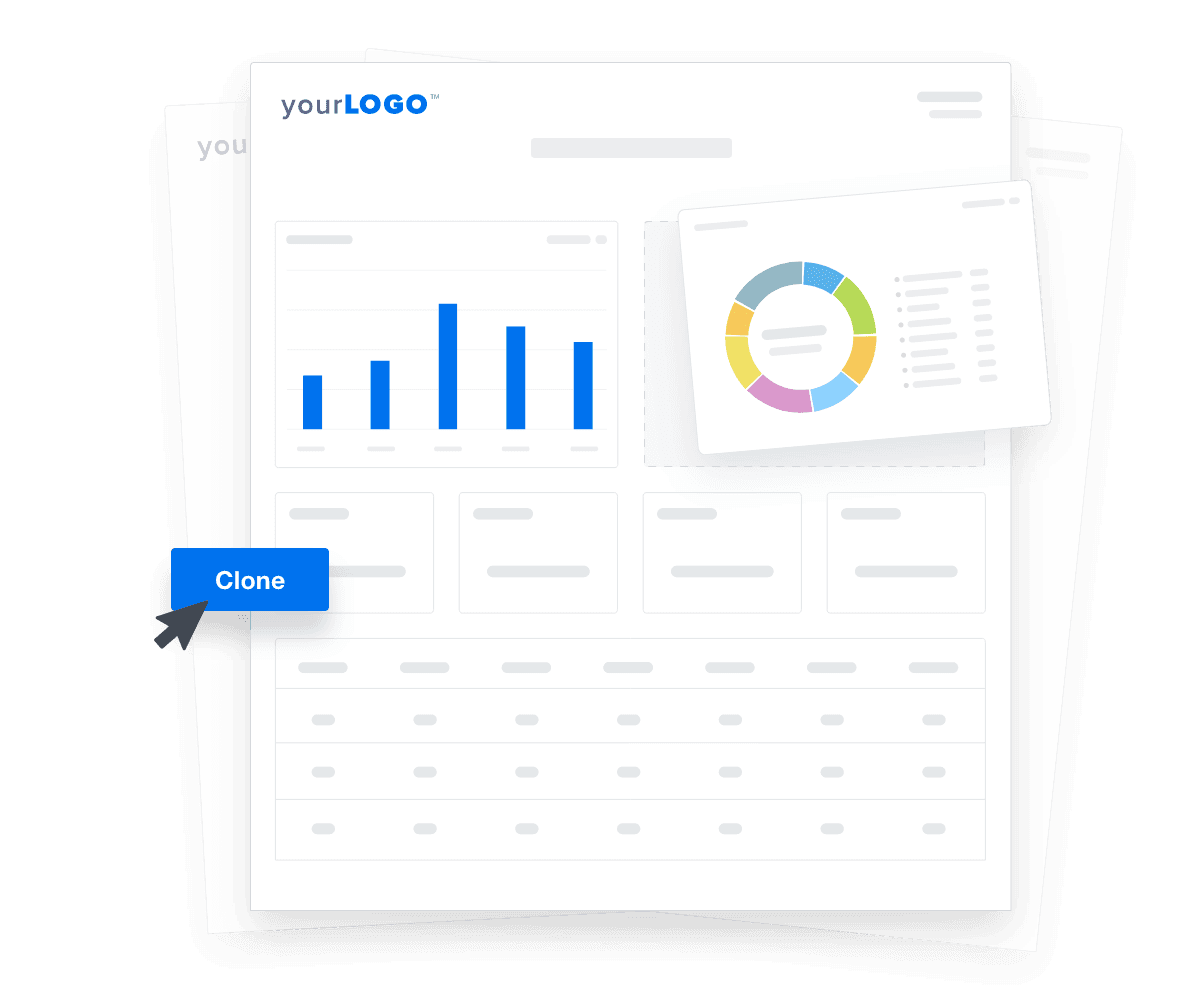
Report Smarter. Not Harder.

Save time and gain deeper insights. Automatically pull in marketing dashboard metrics from 80+ platforms like Google Analytics, Facebook, and Google Ads.

Create a customized marketing reporting dashboard that your client will love. Here’s a bonus: Quickly clone dashboards to streamline onboarding. That way, your marketing teams will have more time to optimize campaigns and grow the business.

Create Custom Dashboards
An illustration of cloning marketing reports and dashboards for faster client onboarding
Create Custom Dashboards

Sign up for your free trial now!

No credit card required. No setup hassle. Just instant access to automated reporting, custom dashboards, and multi-channel insights.

Start Your Free Trial
An icon showing a user clicking to start a free trial
Start Your Free Trial

Insights & Metrics To Include in a Campaign Performance Dashboard

A well-structured campaign performance dashboard does more than display data. It’s designed to help clients quickly grasp key insights. Focus on key metrics (like the ones below) to provide clarity and make informed decisions.

Easily view website analytics from platforms like Google Search Console. Provide key updates on impressions, click-through rates, and average search position. Automatically check for any sitemap errors, alerts, and other related issues.

For a clear view of your client’s paid campaign performance, include an overview in their custom marketing dashboard. Whether it's Microsoft Ads or Google Ads data, reporting on these key insights is simple. Track metrics like click-through rate, ad costs, and more to stay on top of campaign success.

Provide a clear, real-time summary of your client’s website search performance. Through the Google Analytics integration, monitor metrics like sessions and event count. That way, clients will understand whether they’re hitting traffic numbers and getting enough visibility.

Keep on the pulse of your client’s social media performance. Create a dashboard overview to report on their campaigns from Facebook, Instagram, LinkedIn and other top platforms. Monitor social media engagement, impressions, and any follower count changes. 

Sending a newsletter is just one part of the equation. Let clients know whether their email campaigns are driving desired results. 

From Mailchimp to ConstantContact, it’s a breeze to integrate email platform insights into a high-level marketing KPI dashboard. Track open rates and any changes to subscriber count, in addition to other key email metrics. 

Page impressions refer to the total number of times a piece of content is viewed, whether clicked on or not. This social media metric tracks every instance that a post appears on a user’s feed, giving a broader sense of content reach. 

Use page impressions to assess a campaign's overall visibility. A high number means content is being seen by more users, which may lead to more tangible results (like engagement). On the other hand, a low number could indicate that improvements are needed (e.g., using more compelling imagery).

Engagement measures how actively users are interacting with your client’s content. It’s calculated by adding the total number of user actions (likes, comments, shares), which reflects the audience’s interest beyond passive viewing.

A high level of engagement indicates that your client’s content is resonating and piquing interest in some way. On the other hand, a low number may require revisiting the messaging or creative. It may also mean inviting users to engage (e.g., including “Comment below” in a social media caption). 

Sessions refer to the total number of visits to your client’s website within a specified timeframe. Each session begins when a user interacts with a site and ends after 30 minutes of inactivity (or before, if the user exits). It’s a key indicator of overall site traffic and user engagement patterns.

Monitor sessions to fine-tune campaigns and ensure your client’s website is generating enough organic traffic. To address a low number of sessions, focus on refining keyword strategies, optimizing landing pages, or increasing outreach efforts.

Website Analytics Dashboard Overview

Build custom campaign performance dashboards that deliver results

Save time and impress clients with a powerful, results-driven dashboard template. Access the free campaign performance dashboard template today!

Preview the Dashboard
Illustration of a user at a marketing agency trying the client reporting features from AgencyAnalytics
Preview the Dashboard

Event count tracks how many specific actions users take on your client’s website or app (e.g., clicks, form submissions, or downloads). Each event is logged to show engagement with content or interactive elements. This way, your agency is better equipped to identify top-performing content and the most common user actions.

A high event count suggests that users are taking meaningful actions, which may translate to a meaningful conversion later on. If this number is low, consider optimizing the user experience (e.g., improving website navigation) or simplifying calls to action. 

Average search position shows where your client’s website ranks in the SERPs for specific keywords. This metric helps gauge visibility and whether your client’s content aligns with user search intent. 

A high position (lower numerical value) means their content is appearing near the top of the SERPs, leading to greater exposure and potential traffic. If their position is low, focus on improving keyword relevance or the overall content marketing strategy. 

Open rate measures the percentage of recipients who open an email relative to the total number of emails delivered. This metric reveals the effectiveness of subject lines and provides insight into your client’s sending reputation.

A high open rate is a great sign. While it doesn’t include engagement, it shows that your client’s email is catching initial attention (at the very least). To address a low rate, consider adjusting subject lines, sender names, or delivery times. 

Unsubscribed contacts refer to the number of recipients who choose to opt out of receiving your client’s future emails. This metric shows how well email content meets audience expectations and offers insight into overall subscriber satisfaction.

Use this data to monitor the health of email lists and the relevance of email marketing efforts. To address an abnormally high rate, consider reviewing email frequency, improving content relevance, or using a more personalized approach.

Conversion rate measures the percentage of users who complete a desired action, such as making a purchase, signing up for a service, or filling out a form. 

It’s a useful metric for assessing the success of PPC campaigns and is also commonly used across other marketing efforts (e.g., social media and email marketing). 

A high conversion rate indicates that your client’s campaign is resonating with the target audience and leading to tangible results. To fix a low rate, consider improving the landing page design or optimizing calls-to-action.

Total ad cost refers to the overall amount your client spends on advertising campaigns. This figure includes all expenses related to ad placements, clicks, impressions, and other associated costs.

Reporting on this metric helps clients have a clear understanding of their total financial investment across platforms, including Facebook Ads, Instagram Ads, and Google Ads. It also shows whether your client’s spend has yielded expected results and sufficient ROI. 

New links refer to freshly acquired backlinks that direct users to your client’s website. This metric directly impacts search engine rankings and website authority, which is why it’s worth reporting on.

Acquiring new, relevant links demonstrates your agency’s ability to form meaningful outreach partnerships and boost a client’s online reputation. To build a solid backlink profile, focus on guest post collaborations with authoritative websites and creating relevant content. 

An essential part of client management is reporting on progress. What better way to do that than through real-time goal tracking? This visual feature gives clients a clear view of their progress, ensuring their objectives are on track. It keeps everyone aligned and confident that the plan is moving in the right direction.

Whether it’s meeting a quarterly lead generation target or acquiring a specific number of backlinks, this visualization is a must-have for any campaign performance dashboard.  

An example of event and conversion tracking metrics in the GA4 reporting tool

FAQs About Custom Campaign Performance Dashboards

Still have questions about how to create and use custom Campaign Performance Dashboards? Don’t worry, we’ve got you covered.

  • A campaign performance dashboard is a digital marketing dashboard that tracks key marketing metrics across campaigns. It consolidates data from paid ads, social media, SEO, email, and more to help agencies evaluate performance, report on marketing efforts, and align activities with business goals.

  • To create a white label Campaign Performance Dashboard, choose a template, connect your data sources, and apply your agency’s branding. On select plans, easily white label the dashboard with your logo, color palette, and domain. Integrate metrics from over 80 data connectors—including web analytics dashboards and social media platforms.

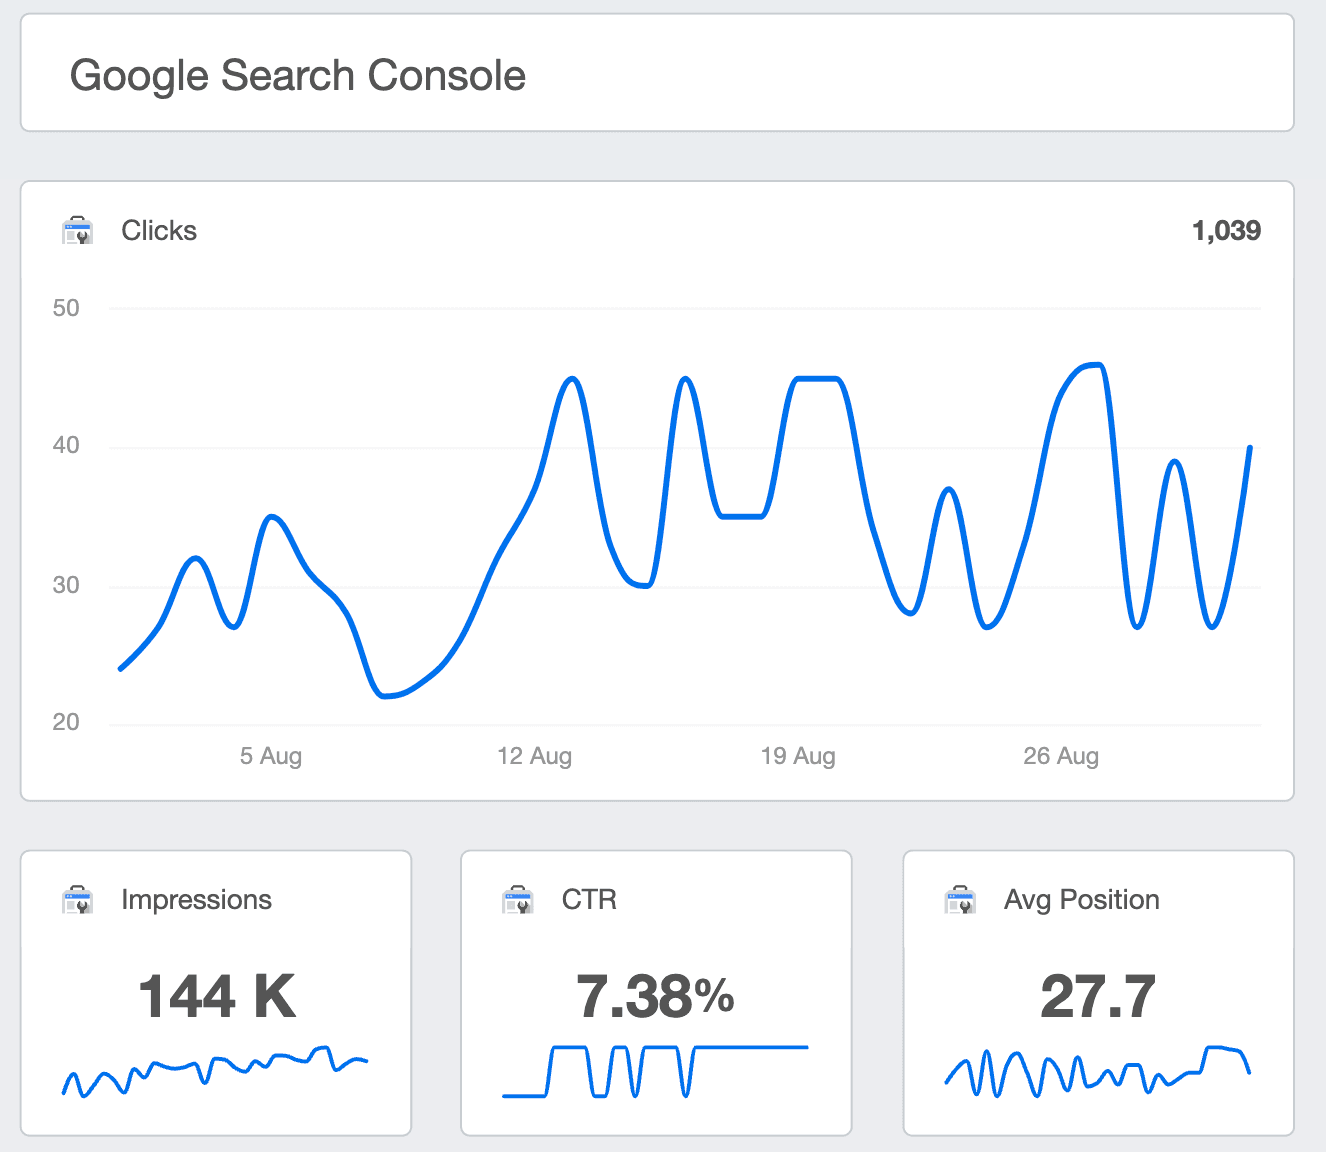
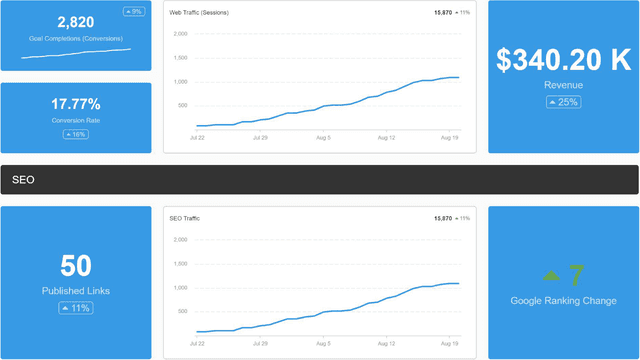
  • Track key performance indicators such as impressions, clicks, conversions, cost per acquisition, and lead generation. Monitor results across ad campaigns, email marketing dashboards, SEO dashboards, and social media marketing dashboards to get a complete view of your marketing strategy.

  • By visualizing key marketing metrics in one place, the dashboard helps you quickly identify what’s working and where to optimize. This centralized view supports faster, data-driven decisions and keeps your team aligned with marketing objectives.

  • Yes. A campaign performance dashboard improves team collaboration by providing shared visibility into marketing KPIs. Teams can reference the same data when planning or adjusting campaigns, making it easier to align efforts and deliver on shared goals.

  • Yes. AgencyAnalytics offers dozens of marketing dashboards, including SEO dashboards, email marketing dashboards, and Google Ads templates. Browse our library of marketing dashboard examples to find one that fits your needs—or create a marketing dashboard from scratch.

  • Yes. The Campaign Performance Dashboard template in AgencyAnalytics is fully customizable. Choose the metrics that matter, rearrange widgets, and align the layout with each client’s reporting needs. Build digital marketing dashboards that support individual marketing strategies and goals.

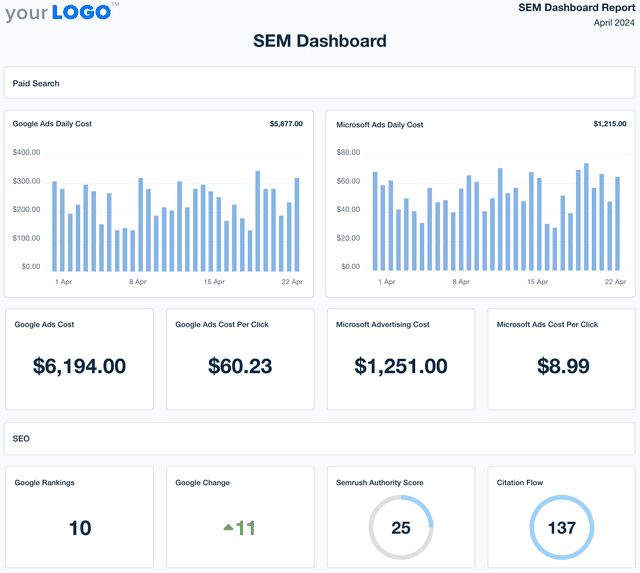
  • Agencies often rely on the web analytics dashboards to manage web analytics data, the PPC reporting dashboards to analyze PPC results, and the social media dashboard template to report on social media performance. They also use the online marketing dashboard for digital marketing campaign summaries and the SEO dashboard to monitor SEO engagement.

More templates

Digital Marketing Dashboard Template Example

Digital Marketing Dashboard

Bring all your client’s digital marketing metrics together in one place. From SEO and PPC to social and email, a customizable dashboard makes reporting faster and clearer—for both your agency and your clients. Join over 7,000 successful agencies and experience the benefits of using a customizable digital marketing dashboard!
SEM Dashboard Template Example

SEM Dashboard

Track CTR, conversions, and paid search ROI in a fully customizable SEM dashboard. Automate reporting, provide clients with live access to campaign data, and optimize search engine marketing strategies for better results across platforms.
An example of AgencyAnalytics' Web Analytics Dashboard template

Web Analytics Dashboard

Unify web analytics from platforms like Google Analytics, Matomo, and 80+ marketing channels in a single dashboard. Monitor live engagement metrics, optimize campaign performance, and present insights in a client-friendly format that reflects your agency’s brand. Give your agency the edge to make smarter marketing decisions and improve results.
View All Templates

See how 7,000+ marketing agencies help clients win

Start Your Trial Now

Free 14-day trial. No credit card required.

Callout Get StartedSwoosh
Logo
G2 Users Love Us
AgencyAnalytics - G2 Leader Winter 2026
AgencyAnalytics - G2 Momentum Leader Winter 2026
G2 Crowd

4.7 out of 5

Capterra

4.8 out of 5

Product
Platform features
Agency solutions
Data integrations
Compare platforms
Reviews
Pricing
Company
About
Careers
Hiring
Media Kit
Contact
Get Started
Start Free Trial
Book a Demo
Quick Start Guide