AgencyAnalytics
AgencyAnalytics
  • Pricing
  • Login
  • Start Trial

Facebook Ads Dashboard for Ad Performance and Client Reporting

Track Facebook Ads performance across campaigns in one streamlined dashboard. Consolidate spend, clicks, conversions, and ROI into a single view that keeps your team and clients aligned and engaged.
Start Your Free Trial Preview Dashboard
Facebook Ads Dashboard Template

Why Use AgencyAnalytics To Track Facebook Ads

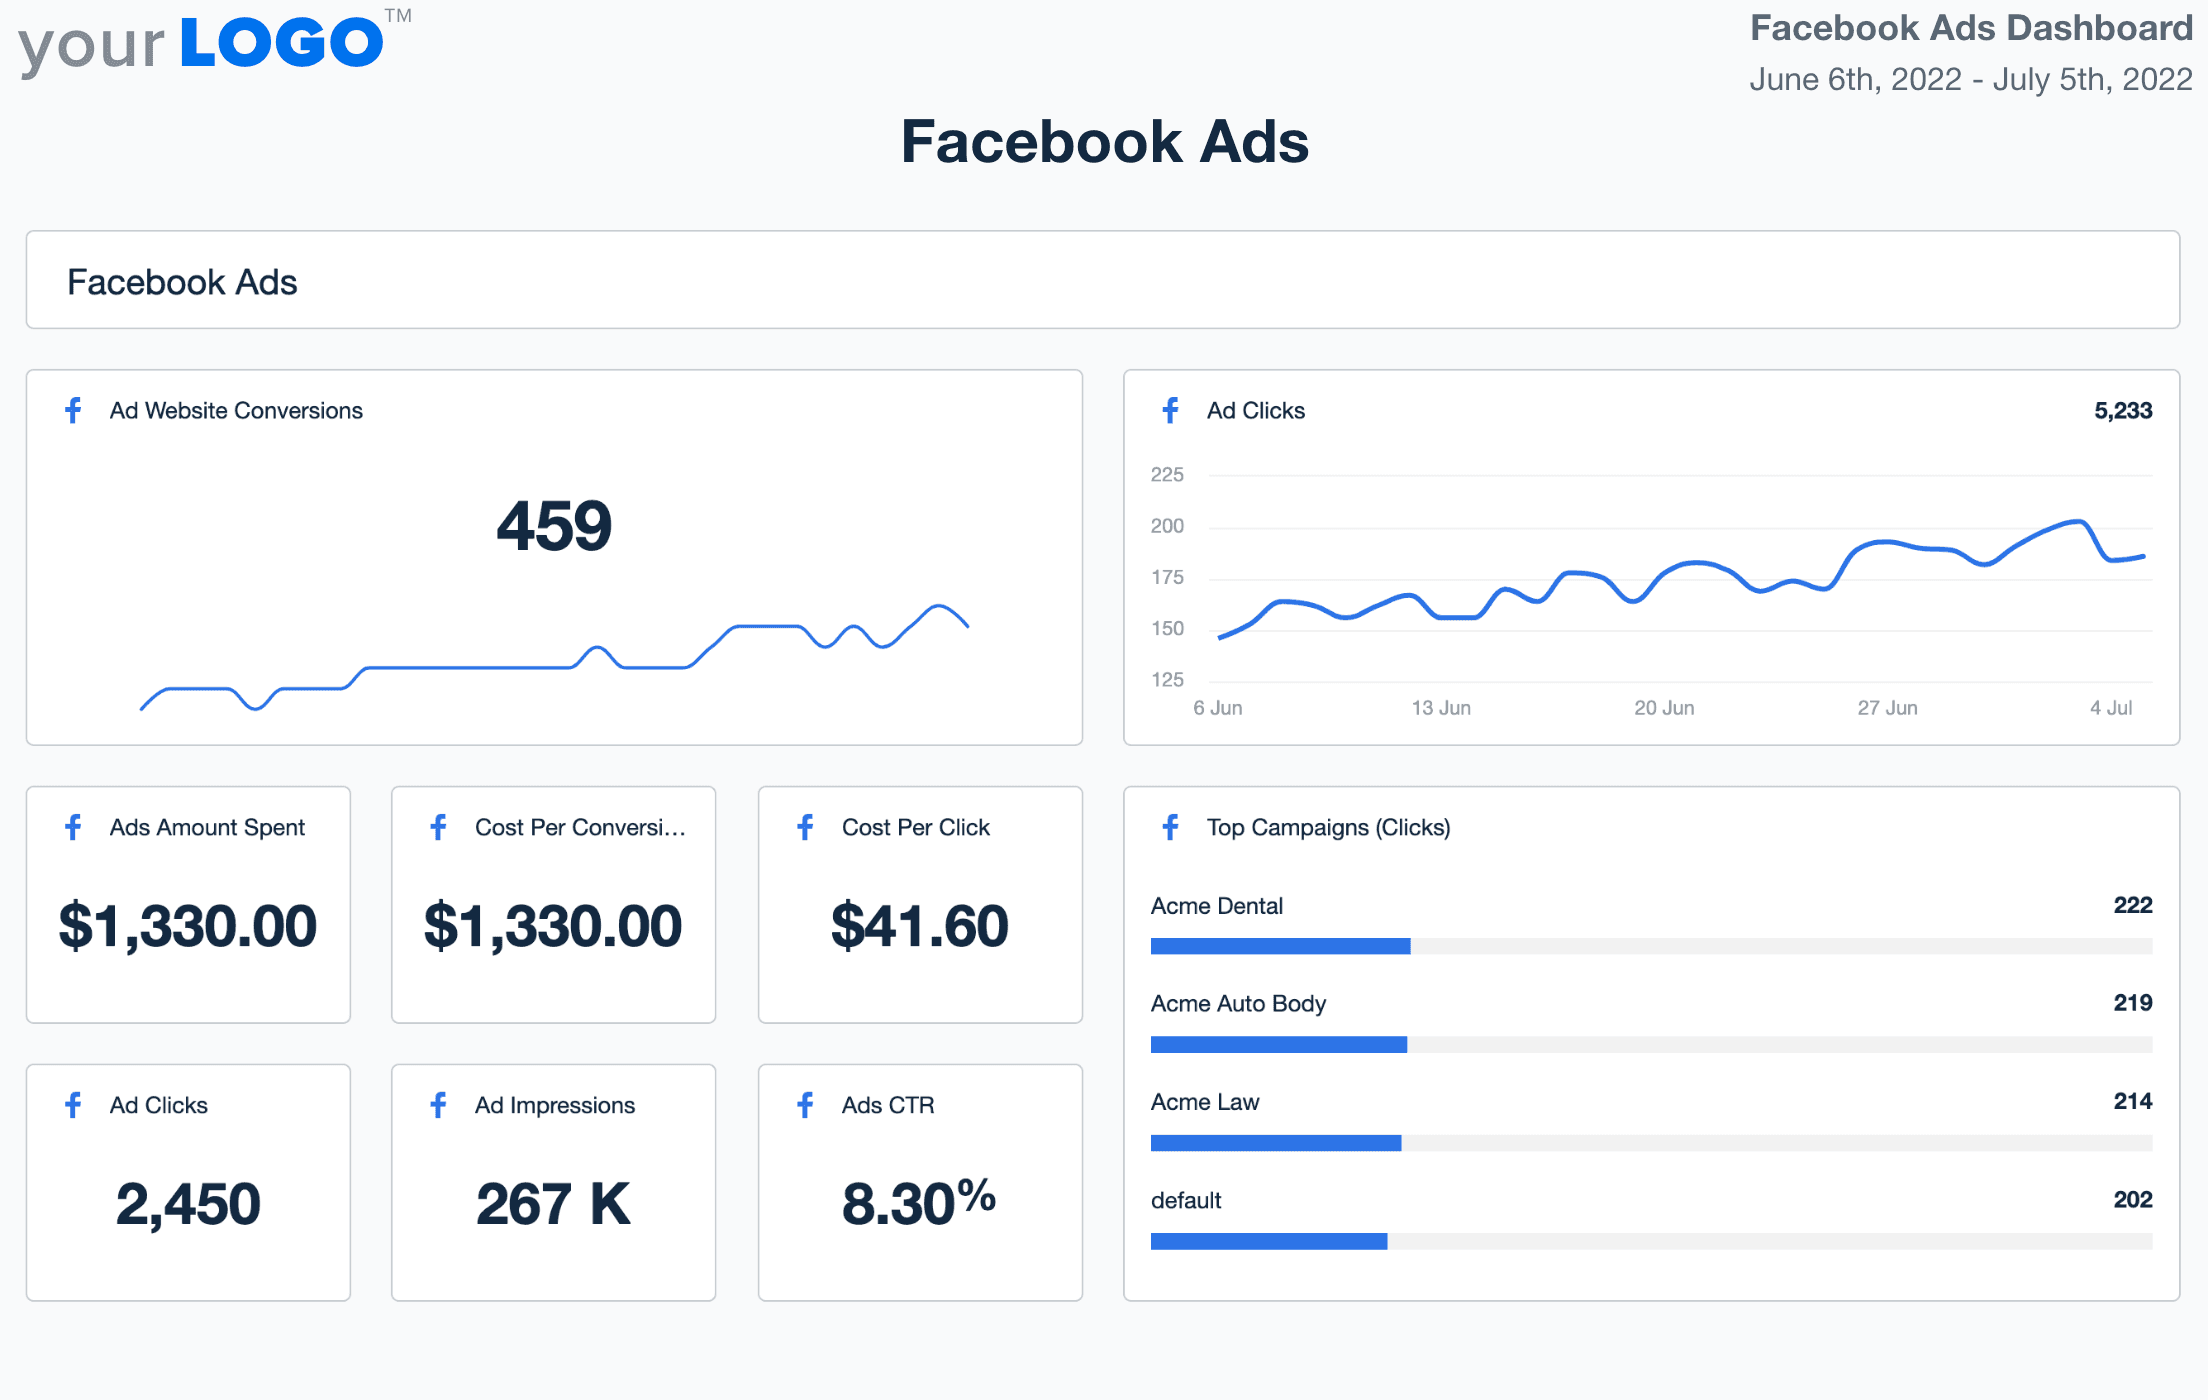
Customizable Facebook Ads Dashboard Built for Agencies

Deliver client-ready insights that cut through the noise. Highlight the metrics that matter—CTR, ROAS, impressions, cost per conversion—and turn ad performance into clear, actionable insights.

With white label customization, brand your dashboard to reflect your agency identity. Clients see a professional reporting experience while your team saves hours each week with automated data pulls and visualizations.

Skip the spreadsheets and focus on refining ad strategy, audience targeting, and spend efficiency—all powered by a live Facebook Ads dashboard.

Create Professional Facebook Ads Dashboards in Minutes
An illustration of the drag-and-drop Facebook Ads dashboard builder for marketing agencies
Create Professional Facebook Ads Dashboards in Minutes

Easily Report on All Your Client's Facebook Ads Data

Start Your Free Trial

Custom Facebook Ads Dashboards as Unique as Your Agency

Monitor Clicks, Impressions, and Conversions

Track Performance Over Time

No more digging through Facebook Ads Manager or downloading spreadsheets to analyze performance. Track conversions, clicks, impressions, and cost at a granular level. The dashboard reporting tool is quick and easy to set up too.

Preview the Facebook Ads Dashboard
Monitor Clicks, Impressions, and Conversions in a Facebook ads dashboard
Preview the Facebook Ads Dashboard
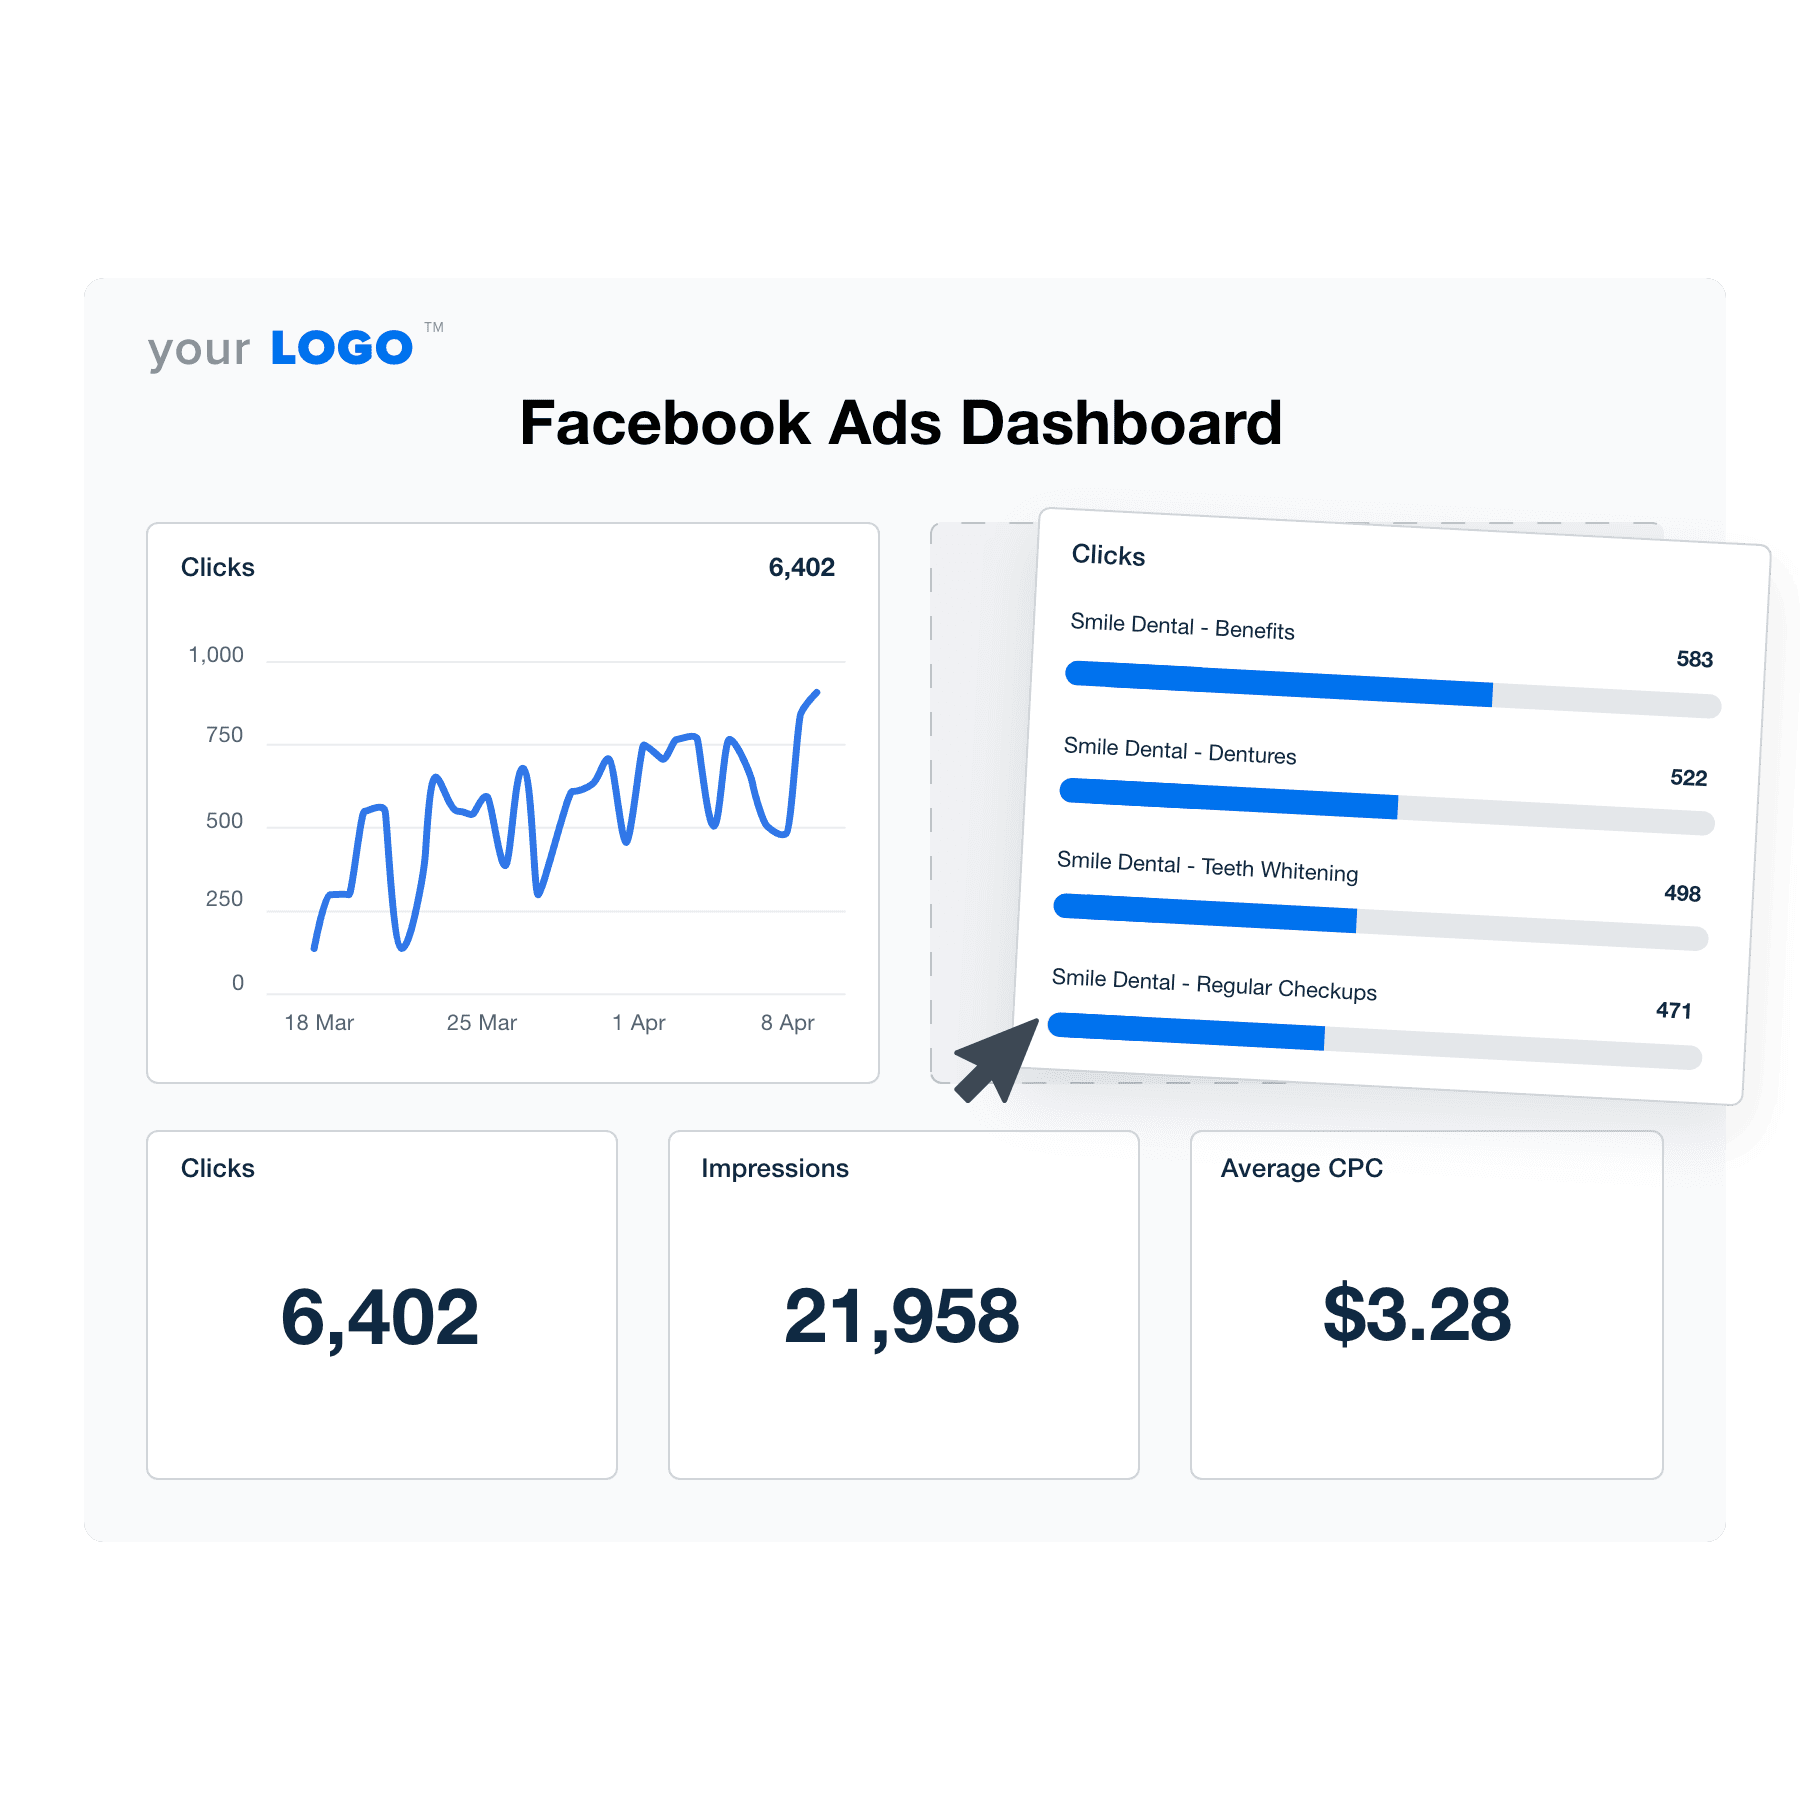
Just The Right Amount of Data

Intuitive Customer Dashboards

Your clients are individuals. Some may be tech-savvy marketing wizards, others may be great at running their business but not be familiar with marketing. Save time and frustration on both ends by controlling exactly which data points each client can access in a custom Facebook Ads dashboard.

View All Management Features
Facebook ads live dashboard template
View All Management Features
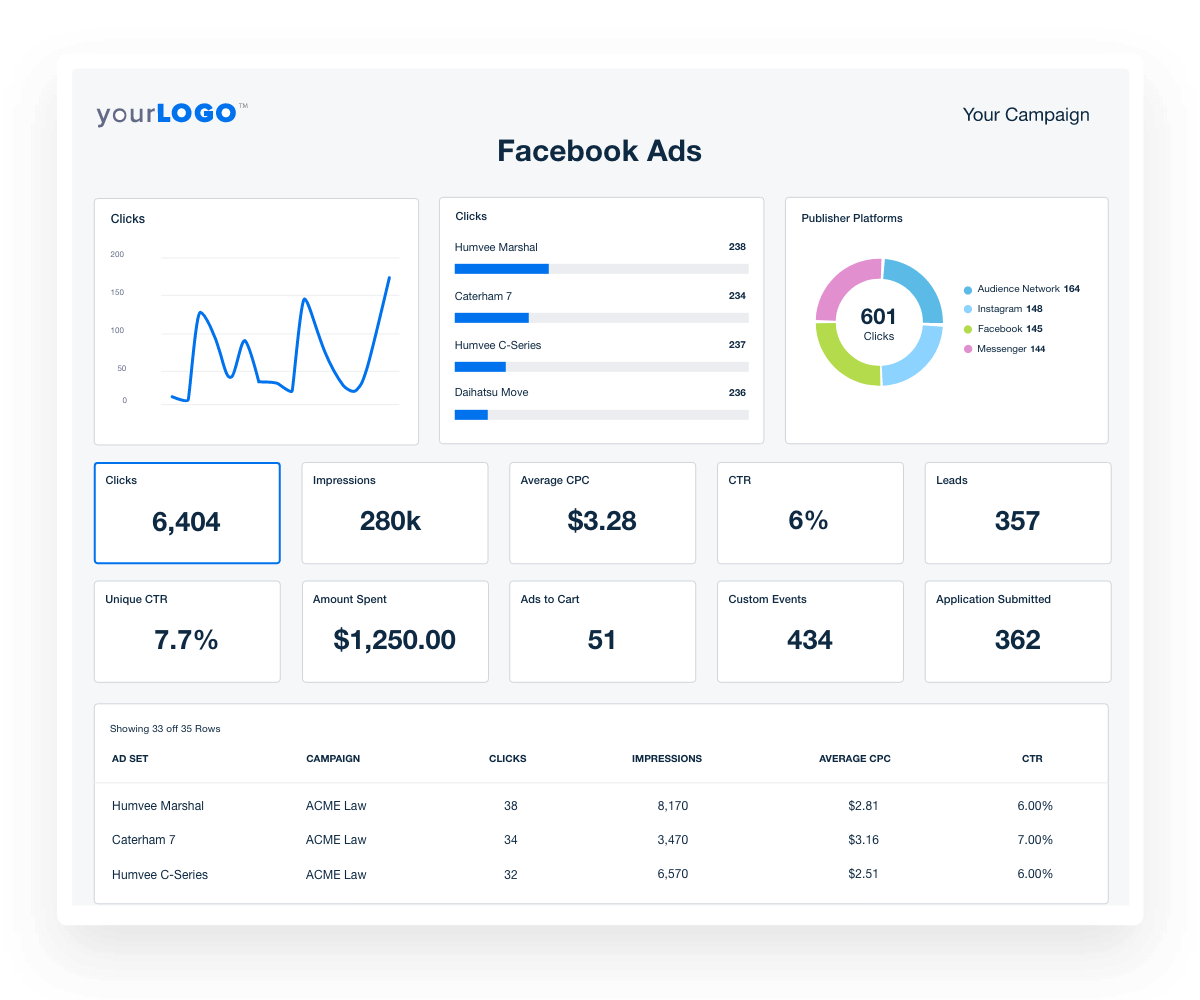
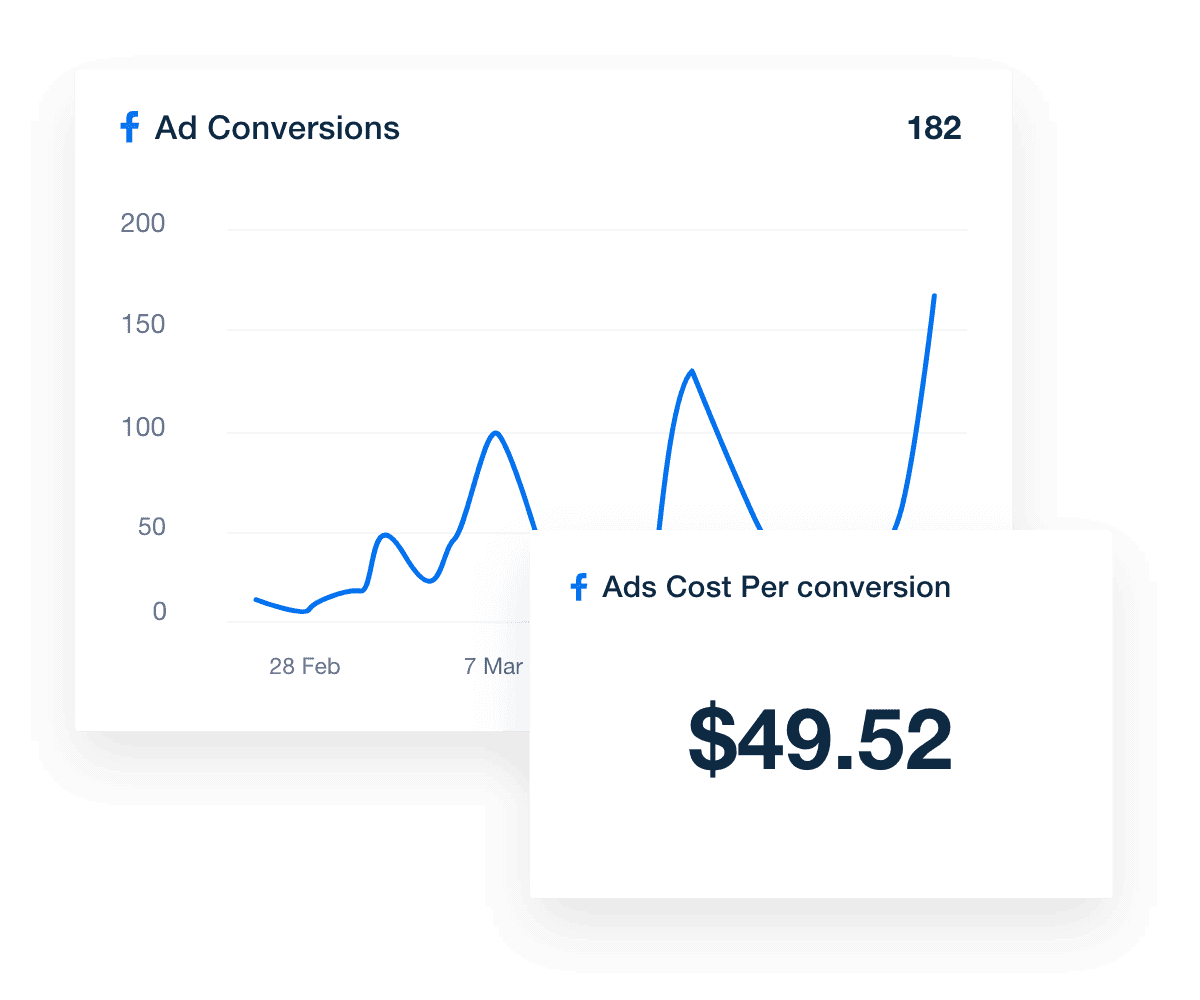
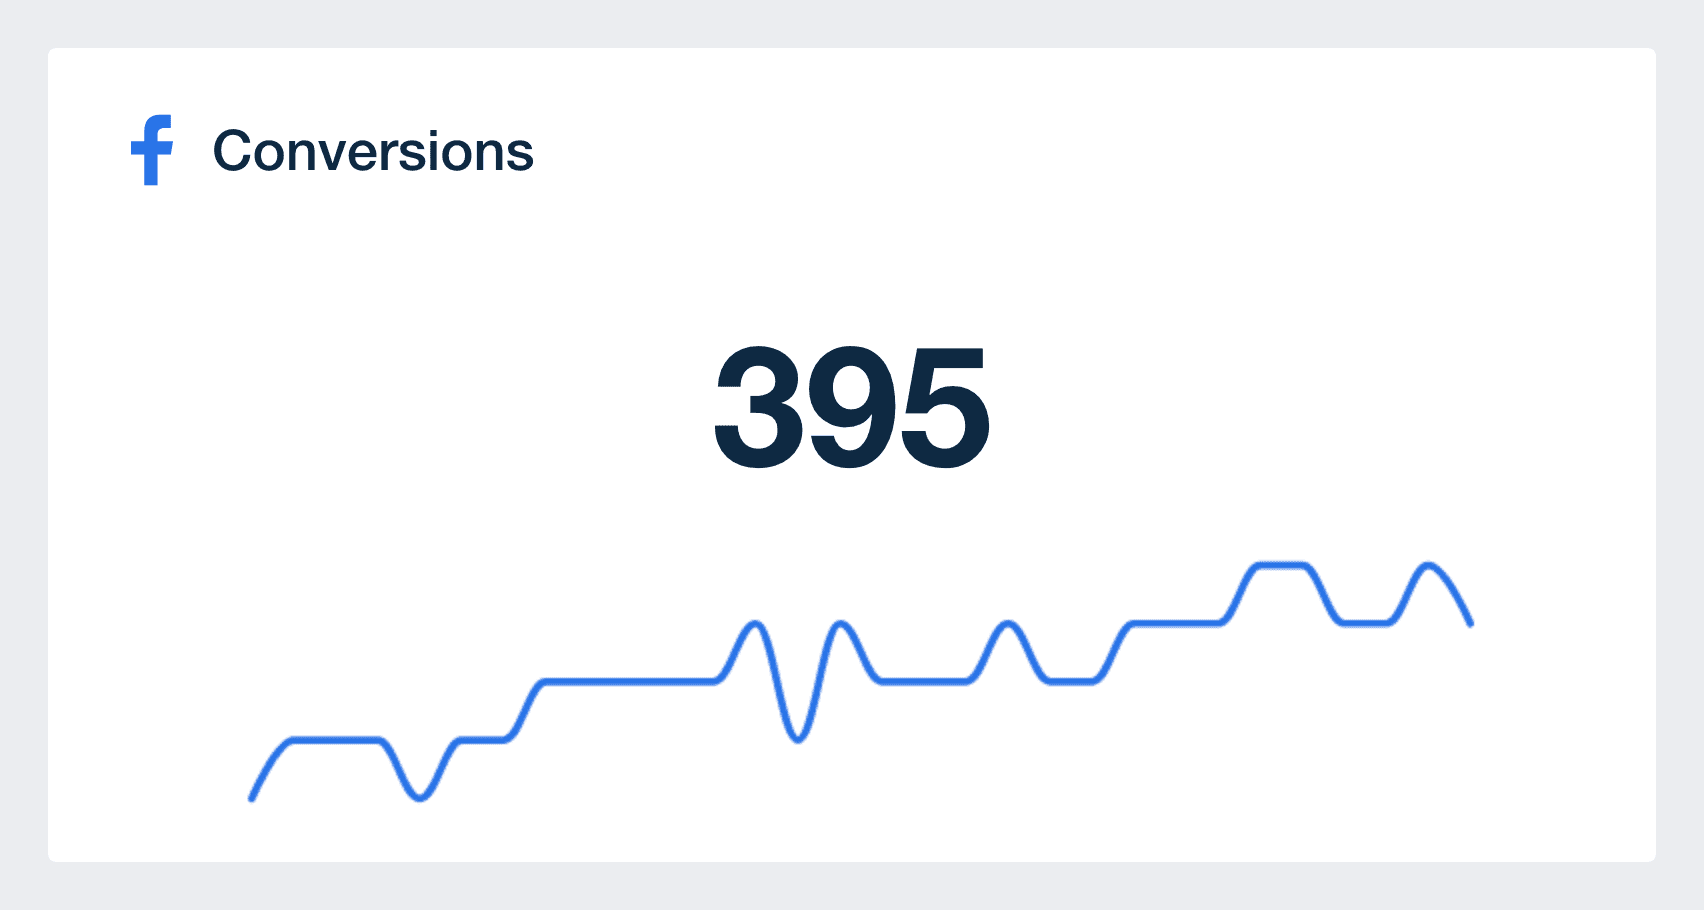
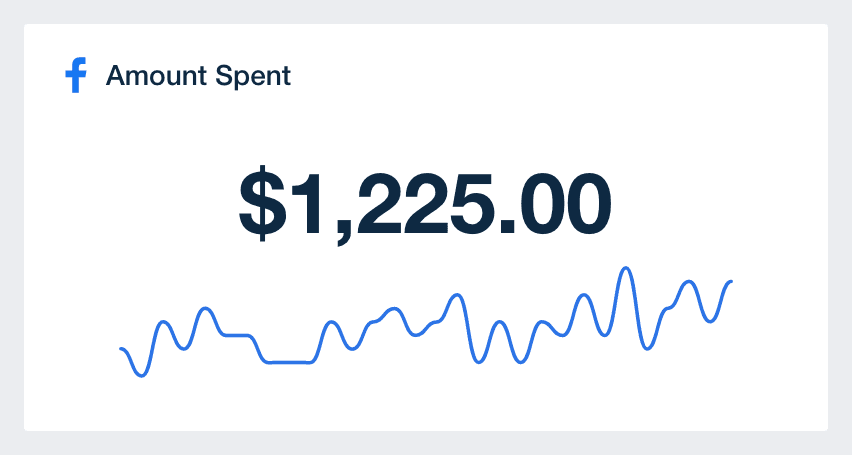
Conversions Are King

Prominent Focus on ROI-Based Metrics

Website conversions at a reasonable cost–isn't that what your clients really care about? The Facebook Ads module prominently features ROI-based metrics (CPC, conversions, conversion value, etc.), drawing focus to the value your agency provides.

Preview the Facebook Ads Dashboard
Facebook ads conversions and cost per conversion widget in dashboard
Preview the Facebook Ads Dashboard
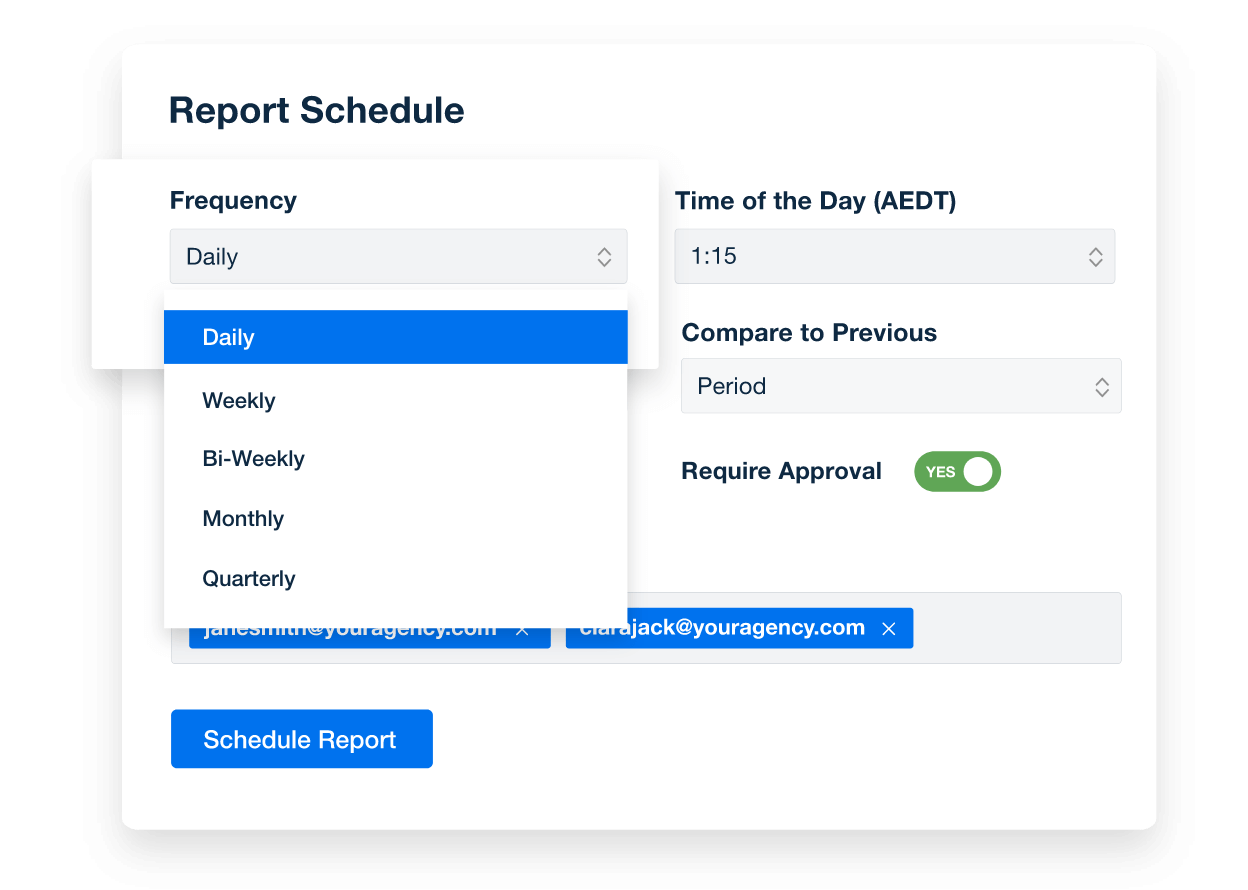
AUTOMATED FACEBOOK ADS REPORTING

Report Smarter, Not Harder

Make reporting a breeze for your agency! Streamline report generation and delivery on a daily, weekly, or monthly basis. Embrace the power of automation and focus on delivering exceptional marketing results for your clients.

With over 80 marketing integrations at your fingertips, you'll get a comprehensive view of your clients' marketing performance across various PPC platforms like 

Facebook Ads, Google Ads, and more. Say goodbye to manual reporting and hello to more time for strategic tasks, all while keeping your clients engaged with regular, automated reports!

Automate Your Reporting
An example of marketing report scheduling options from AgencyAnalytics
Automate Your Reporting
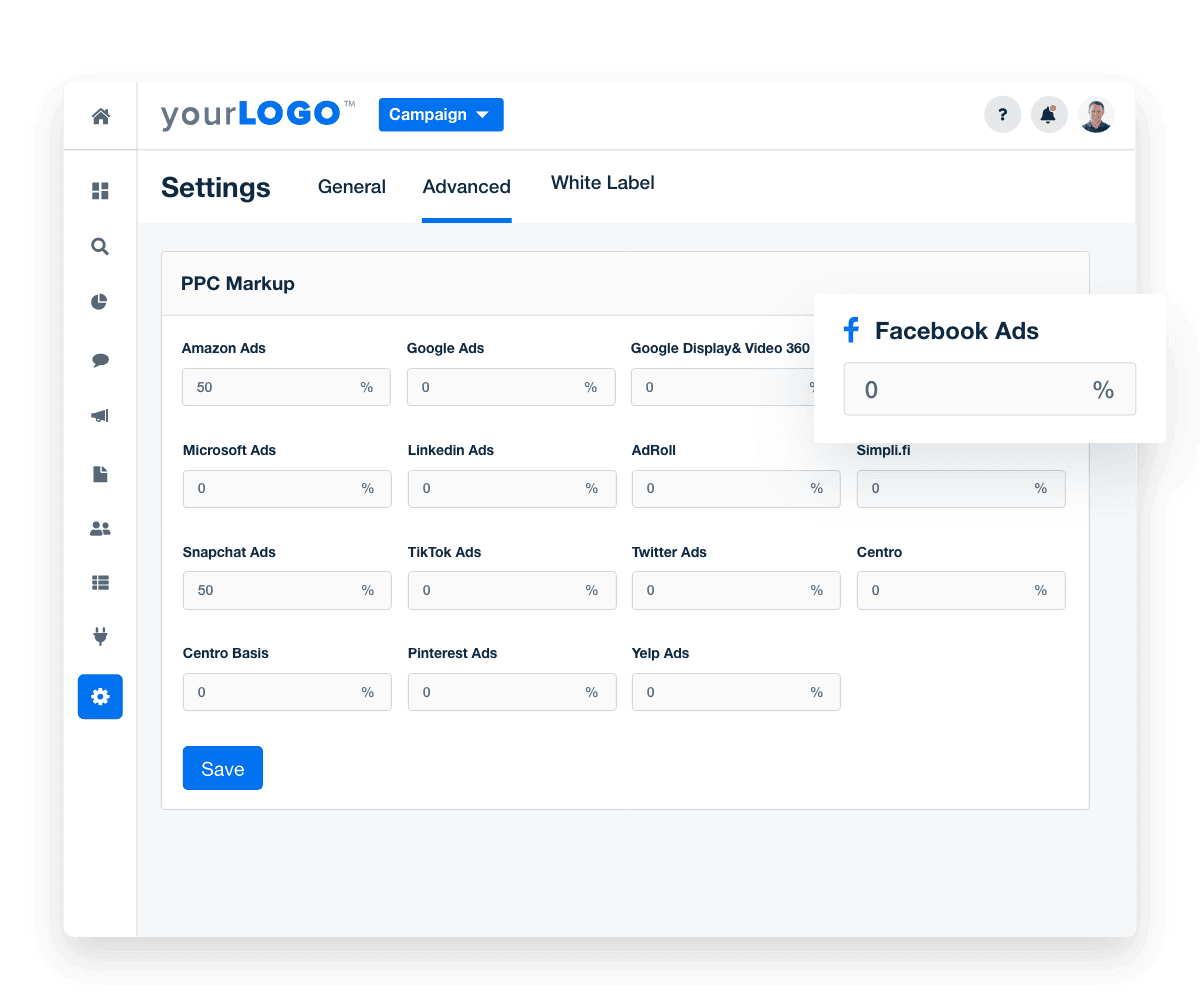
Include Your Margin in All Client Reports

Add Your Markup to Client PPC Data

Grocery stores don't show customers their wholesale pricing. So why should you show your agency’s clients? Automatically add a custom Facebook Ads markup to all client-facing dashboards and reports so they see the total cost in a seamless report.

Add Your Agency's PPC Markup
Add Your Markup to Client PPC Data in Facebook ads dashboard
Add Your Agency's PPC Markup
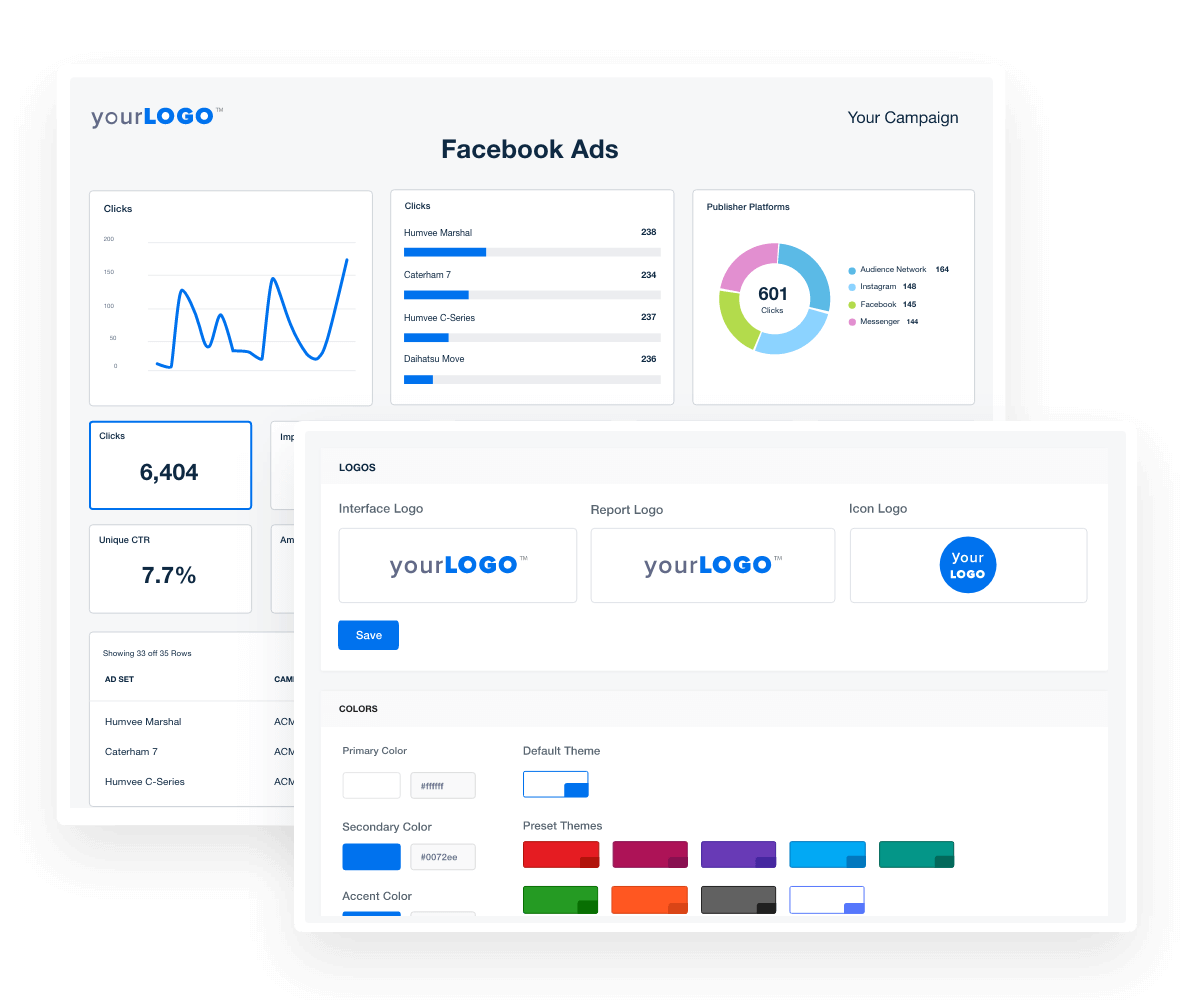
White Label Facebook Ads Dashboard

Give Clients Live, 24/7 Data

Clients want real-time campaign performance data. You want to enhance your brand presentation. AgencyAnalytics is a win-win! Give clients their own login to a live, custom white label dashboard seamlessly branded with your agency's logo, colors, and domain.

View All White-Label Features
white label features in Facebook ads dashboard
View All White-Label Features

Sign up for your free trial now!

No credit card required. No setup hassle. Just instant access to automated reporting, custom dashboards, and multi-channel insights.

Start Your Free Trial
An icon showing a user clicking to start a free trial
Start Your Free Trial

What’s Included in Your Facebook Ads Reporting Dashboard Template

A conversion is the ultimate end result when a prospect engages with your Facebook Advertising campaign by viewing and clicking on an ad. The types of conversions vary depending on your clients' specific goals.

Tracking conversions in your Facebook Ads dashboard is undoubtedly one of the most critical performance data points. It provides essential insights into how effectively you're drawing people into your clients' customer journey funnel and determines the success of their Facebook ad campaign.

For instance, having a high Click-Through Rate (CTR) on a Facebook ad CTA but low conversions on a landing page would highlight the landing page as a potential issue. In such cases, your next course of action should be to investigate and optimize the landing page CTA to boost conversions.

Are your clients’ Facebook ads yielding profitable results? Cost per Conversion (CPC) is the crucial metric that determines the value of ad clicks and measures whether the money spent is delivering desirable outcomes.

Paying for impressions or clicks is one thing, but understanding the costs associated with achieving a specific action is entirely different. By linking ad spend to conversions, you make Facebook data more actionable and insightful.

It is essential to set a target cost per conversion that aligns with your clients' objectives and leaves them content with the returns on investment. Continuously monitoring and reporting this metric to your clients with your Facebook Ads dashboard demonstrates you are diligent in managing their ad accounts, ensuring they receive optimal returns without overspending.

The impression metric is key for assessing your agency’s Facebook ad campaign performance, revealing how frequently Facebook users encounter your ads within a specific date range. It's important to differentiate between impressions and reach–while impressions reflect the total number of times users viewed an ad within an ad set, it includes multiple views from the same person, not just unique views.

Understanding this vital metric provides valuable insights into your campaign's total number of views, enabling you to gauge its effectiveness. Suppose your Facebook ads dashboard displays high impressions but lacks the desired total number of clicks or conversions. In that case, it serves as a clear indicator that adjustments are needed to optimize performance.

Reach in Facebook ads refers to how many people have viewed your clients’ content on Facebook. It's different from impressions as it only counts the number of unique users that see the ad, regardless of the number of times they see it.

To know how well your marketing campaign is doing, you need to know how many people you have reached out to and what percentage of your audience has engaged with your offer. Easily visualize this metric as a widget in your Facebook Ads dashboard.

Ad frequency is an important Facebook metric that is ignored by most agencies. It’s the number of times each user (on average) has seen an ad, calculated as Impressions/Reach.

If users are seeing the same Facebook ad over and over again without engaging, you know something needs to change. Frequency plays a big role in how Facebook serves ads because it wants to display as few ads as possible for the most number of clicks. So if your frequency is high, Facebook is repeatedly displaying your ads to the same person.

Monitor your frequency data by dragging and dropping this widget in your Facebook Ads reporting tool or your Facebook Ads dashboard. If your Facebook Ads campaigns are continuously showing the same ad to your client’s audience, you will need to change things up. A great way to decrease ad frequency is to create numerous versions of your Facebook ads. Rework the visuals or have a different write-up of each version.

One of the main goals of most campaigns is Clicks. When people click on ads, they're showing interest in the offer you’re presenting and may be on the path to convert.

The aim is often to get users to your client’s landing page, but that's not always the case with Facebook Ads. There are multiple kinds of clicks, and each one denotes a different form of interaction, including click-to websites and click-to-call.

Segment the different types of clicks when optimizing a campaign. When reporting to a client, keep it simple and just display all clicks so as not to overwhelm them with unnecessary information in your Facebook Ads dashboard.

Facebook Ads Conversions Metric in Dashboard Template

Build custom Facebook Ads reporting dashboards that deliver results

Save time and impress clients with a powerful, results-driven dashboard template. Access the free Facebook Ads reporting dashboard template today!

Preview the Dashboard
Illustration of a user at a marketing agency trying the client reporting features from AgencyAnalytics
Preview the Dashboard

Tracking "Amount Spent" is essential for any agency-client relationship. It gives a straightforward view of the budget used in your campaigns, ensuring no surprises when it comes to costs.

By keeping an eye on this, agencies fine-tune strategies to maximize ROI. Plus, it offers a clear link between what's spent and the results achieved. This not only fosters trust but also sets the stage for smarter decisions in future campaigns.

CTR shows you the percentage of consumers who have viewed your ad (impression) and clicked it and is calculated as Clicks/Impressions.

Having a high CTR is vital for an efficient campaign, so ensure your ads are being clicked, or Facebook will stop serving the ad. Low click-through rates happen when the target audience is simply viewing Facebook ads without taking any action which will end up costing you more per click.

This is such an important metric to keep your eye on as it influences your ad campaign's relevance score. If your Facebook ads are receiving impressions void of clicks, Facebook concludes that the target audience does not see your ad as relevant. Keep an eye out for this metric and add it to your Facebook Ads dashboard template.

CPC is your cost per click and is calculated as Cost/Clicks. Tracking the CPC metric is a way to get the most out of your client’s ad budget and is one of the best barometers to see if your campaigns are becoming more or less costly over time.

The Facebook ad landscape is a dynamic arena where agencies not only compete with bids but also with ad relevance and quality. Every ad enters an auction, and while the highest bidder has an advantage, the ad's relevance to the user can tip the scales. Factors like ad fatigue, audience overlap, seasonal trends, and market saturation also influence the cost-per-click (CPC).

While engagement metrics like click-through rate (CTR) are essential, they're just part of the equation. Agencies must use a holistic approach, balancing bid amounts with ad quality and market dynamics to ensure efficient ad spend. Easily showcase your CPC in a widget in your Facebook Ads dashboard.

Engagement reveals the number of times Facebook users took action on your clients’ posts. These actions could be sharing your post, posting a comment, clicking a link, or reacting with an emoji. Engagements show your target audience isn’t simply ignoring the ads you're showing them.

When experimenting to discover what resonates best with a specific audience, closely monitoring this metric is essential in your Facebook Ads dashboard template.

Low engagement on a post indicates your clients’ audiences may be looking for something different. Conversely, high engagement on another variation signifies the ad perfectly aligns with your target audience.

On Facebook, unlike some other platforms, impressions are reported only when users see the video ad in motion. This metric provides invaluable insights into the type of video content that resonates with your clients’ target audiences. While it's often said consumers require multiple touches to convert, this metric serves as an initial indicator for retargeting strategies, helping agencies discern which viewers to focus on and which to potentially exclude.

However, it's important to remember this isn't the only video engagement metric available on Facebook. For agencies that prioritize video content, other critical metrics include the percentage of the video watched—with benchmarks at 25%, 50%, 75%, 95%, and 100%—and the average watch time. These metrics provide a more granular understanding of viewer engagement.

For instance, if a significant number of viewers exit after just three seconds without reaching the ten-second mark, it's a clear sign the content might need adjustments. But, by also considering the percentage of the video watched and average watch time, you gain a comprehensive view of how their content is performing in your Facebook Ads dashboard and where improvements might be needed.

Understanding demographics is akin to having a roadmap for your clients' Facebook ad campaigns. When agencies delve into details like age, gender, and location, it's not just data collection; it's strategic insight. Instead of a broad approach, agencies pinpoint the exact audience that matters most in your Facebook Ads dashboard template.

This ensures every budget allocation is intentional and every message is finely tuned for its intended audience. For agencies managing client campaigns, leveraging demographics is paramount for efficient and impactful advertising.

Facebook amount spent metric in the facebook ads dashboard

FAQs About Custom Facebook Ads Dashboards

Still have questions about how to create and use custom Facebook Ads Dashboards? Don’t worry, we’ve got you covered.

  • A Facebook Ads Dashboard is a reporting interface that pulls campaign data from your client's Facebook Ads account, as well as data from over 80 other marketing platform integrations, into one place. It helps marketing agencies track Facebook Ads metrics across ad sets, audiences, and creatives—making it easier to monitor ad performance and optimize Facebook advertising campaigns.

  • To create a white label Facebook Ads Dashboard, connect your client’s Facebook Ads account to a reporting platform like AgencyAnalytics, choose a Facebook Ads Dashboard template, and apply your agency’s branding. On select plans, the dashboard supports full white labeling with your logo, color palette, and domain.

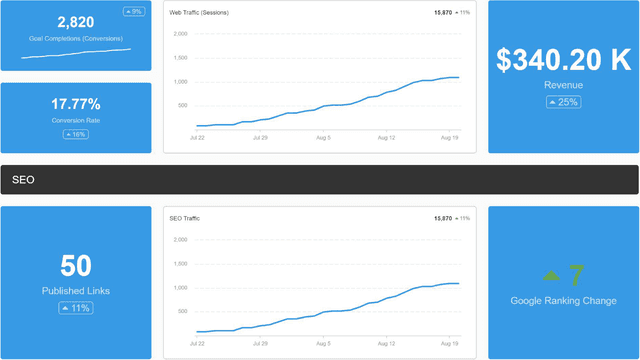
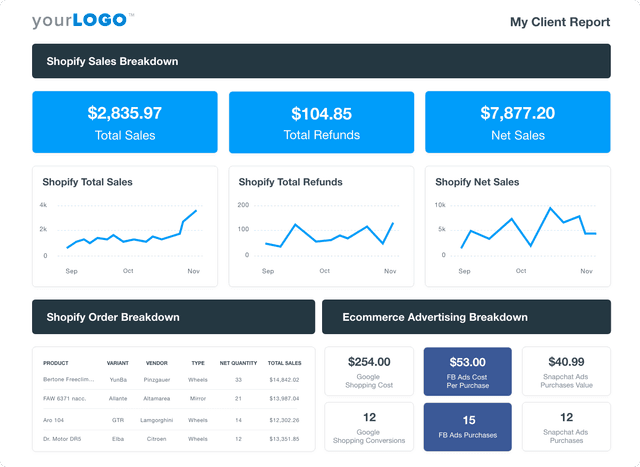
  • Track key Facebook Ads metrics like ad impressions, ad clicks, ad interactions, cost per click, total money spent, conversions, cost per click, and return on ad spend. Whether you're reviewing performance for a single Facebook ad campaign or managing multiple Facebook ad accounts, the dashboard centralizes campaign data for streamlined reporting.

  • By consolidating campaign data in a Facebook Ads Manager dashboard, agencies easily evaluate performance across ad sets and quickly identify what resonates with each target audience. These insights support better budget allocation, creative adjustments, and more effective Facebook advertising reports.

  • Facebook Ads Dashboards help marketing agencies refine digital marketing strategies by showing what drives results for different segments of Facebook users. Analyze performance across Facebook ad campaigns to fine-tune targeting, messaging, and spend across all marketing channels.

  • Yes. Start with a Facebook Ads Dashboard template and tailor the layout, data sources, and metrics to reflect each client’s priorities. Highlight results that matter—whether it’s ad engagement, conversions, or cost metrics—for every Facebook ad campaign.

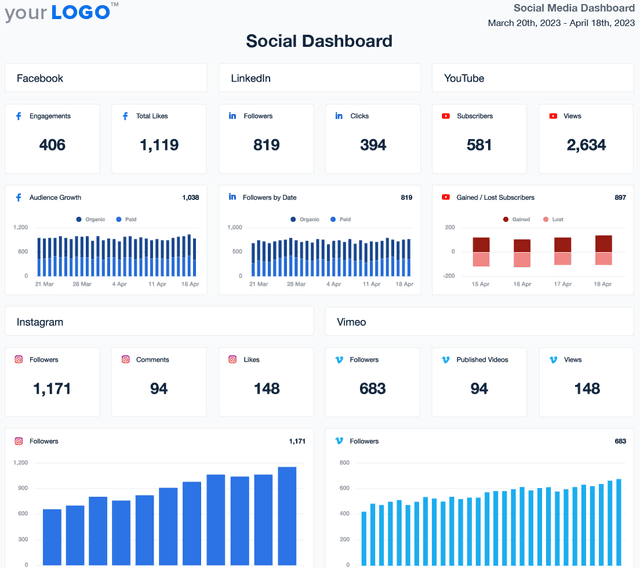
  • Agencies often rely on the digital marketing reporting dashboards to manage digital marketing data, the PPC reporting dashboard to analyze PPC results, and the web analytics dashboard to report on web analytics performance. They also use the SEO dashboards for SEO campaign summaries and the social media dashboard template to monitor social media engagement.

More templates

Social Media Dashboard Template Example

Social Media Dashboard

Track engagement, reach, clicks, and conversions across Facebook, Instagram, LinkedIn, YouTube, and more—all from one customizable social media analytics dashboard. Deliver live insights, save time, and keep clients aligned with your agency’s strategy. Join over 7,000 satisfied customers and experience the benefits of using a social media dashboard!
Digital Marketing Dashboard Template Example

Digital Marketing Dashboard

Bring all your client’s digital marketing metrics together in one place. From SEO and PPC to social and email, a customizable dashboard makes reporting faster and clearer—for both your agency and your clients. Join over 7,000 successful agencies and experience the benefits of using a customizable digital marketing dashboard!
A screenshot of an example ecommerce dashboard

Ecommerce Dashboard

Track sales, conversion rates, PPC performance, and SEO in a fully customizable ecommerce dashboard. Consolidate key metrics in one place, automate reporting, and provide clients with live insights to optimize their online store’s growth. Find out why over 7,000 successful agencies choose AgencyAnalytics to save time, boost profitability, and keep clients on the path to growth.
View All Templates

See how 7,000+ marketing agencies help clients win

Start Your Trial Now

Free 14-day trial. No credit card required.

Callout Get StartedSwoosh
Logo
G2 Users Love Us
AgencyAnalytics - G2 Leader Winter 2026
AgencyAnalytics - G2 Momentum Leader Winter 2026
G2 Crowd

4.7 out of 5

Capterra

4.8 out of 5

Product
Platform features
Agency solutions
Data integrations
Compare platforms
Reviews
Pricing
Company
About
Careers
Hiring
Media Kit
Contact
Get Started
Start Free Trial
Book a Demo
Quick Start Guide