AgencyAnalytics
AgencyAnalytics
  • Pricing
  • Login
  • Start Trial

YouTube Dashboard for Video Marketing Performance and Client Reporting

Track YouTube channel growth, video performance, and engagement metrics in a single dashboard. Automate reporting, save time, and give clients direct access to up-to-date analytics—all while reinforcing your agency’s brand. Spend less time on reporting and more time creating killer YouTube marketing strategies.
Start Your Free Trial Preview Dashboard
YouTube Reporting Dashboard Template Example

Customizable YouTube Dashboard to Monitor and Share Channel Insights

A white label YouTube dashboard helps your agency showcase the impact of video campaigns without the hassle of manual reporting. Track key metrics like watch time, views, subscriber growth, and audience retention in one centralized interface.

Tailor each dashboard to your client’s goals and brand it with your agency’s logo and colors. Whether clients want weekly engagement reports or a live view of campaign performance, this dashboard makes it easy to share meaningful insights and keep conversations focused on strategy.

Create Professional Ahrefs Dashboards in Minutes
An example of the drag-and-drop YouTube dashboard template for marketing agencies
Create Professional Ahrefs Dashboards in Minutes

Easily Track All Your Client’s YouTube Metrics

Start Your Free Trial

Custom Youtube Dashboards as Unique as Your Agency

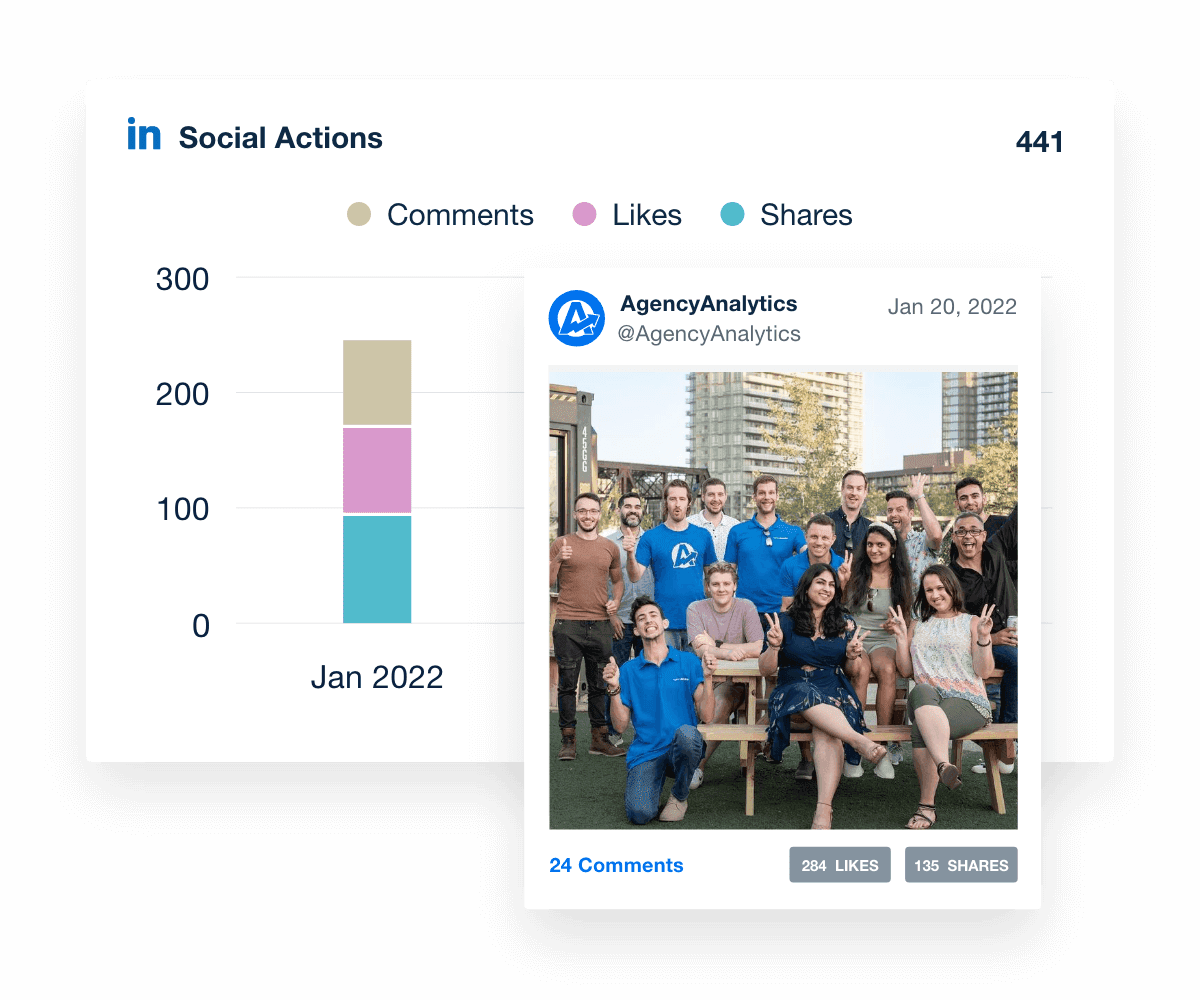
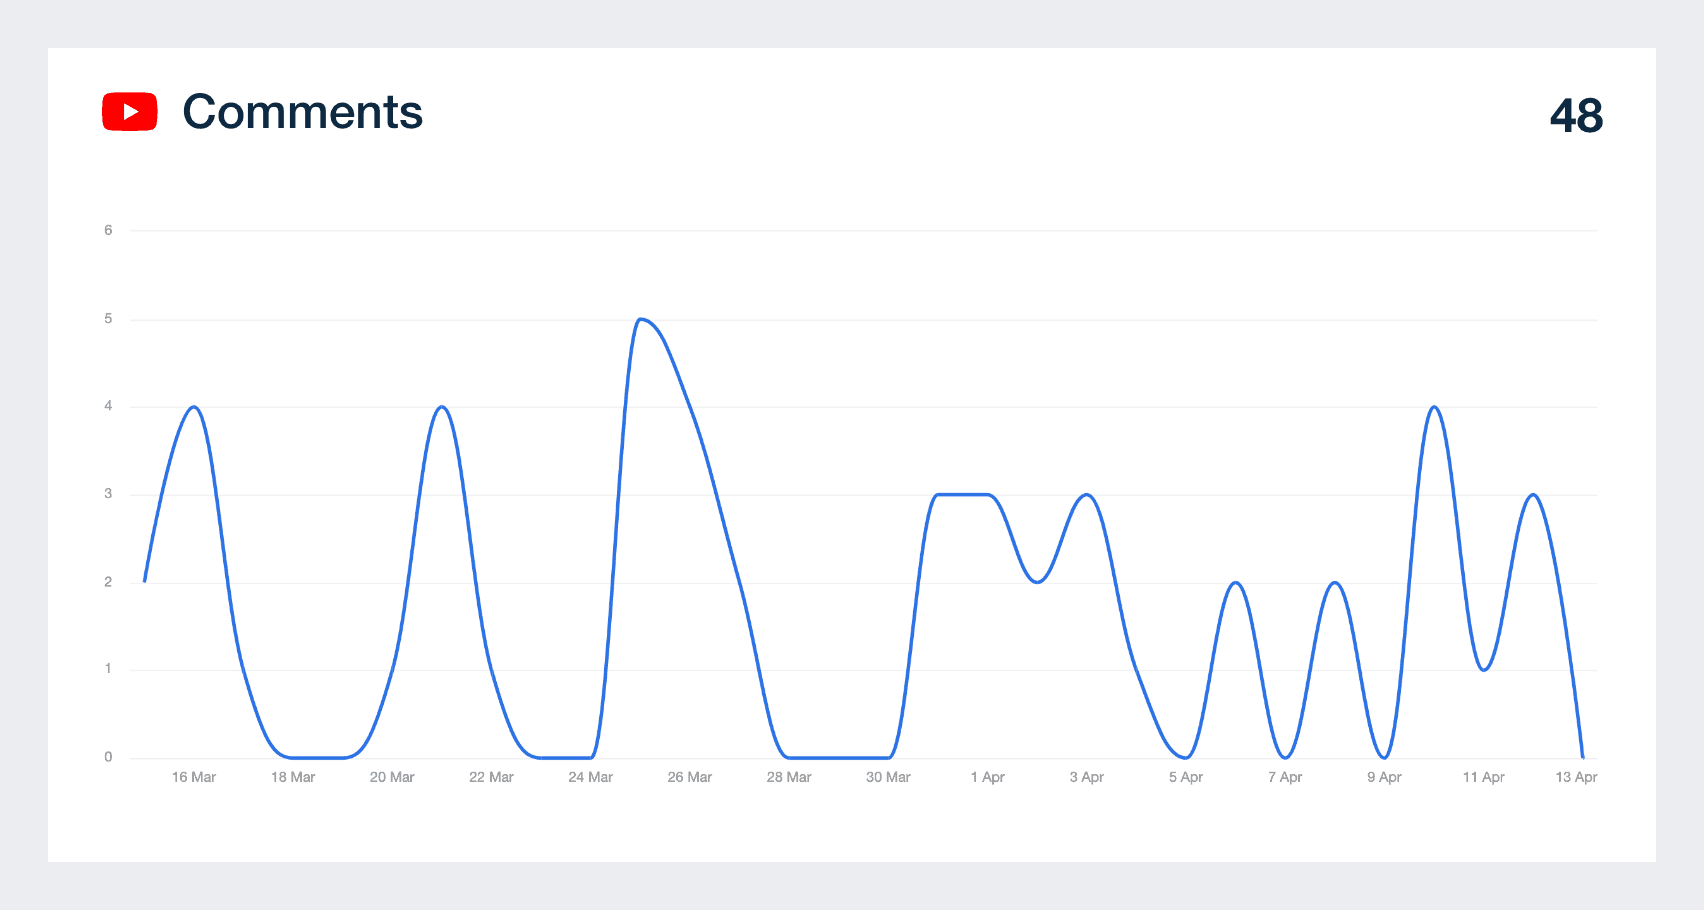
Likes, Dislikes, Comments & Shares

Monitor Engagement

Clients love to see their videos gaining traction. Easily share live engagement metrics with clients in their custom dashboard. You can show off your success using gorgeous graphs measuring likes, comments, and shares so clients know exactly when they get the most engagement.

Visualize Client Success
Monitoring LinkedIn Engagement Metrics with a Live Dashboard
Visualize Client Success
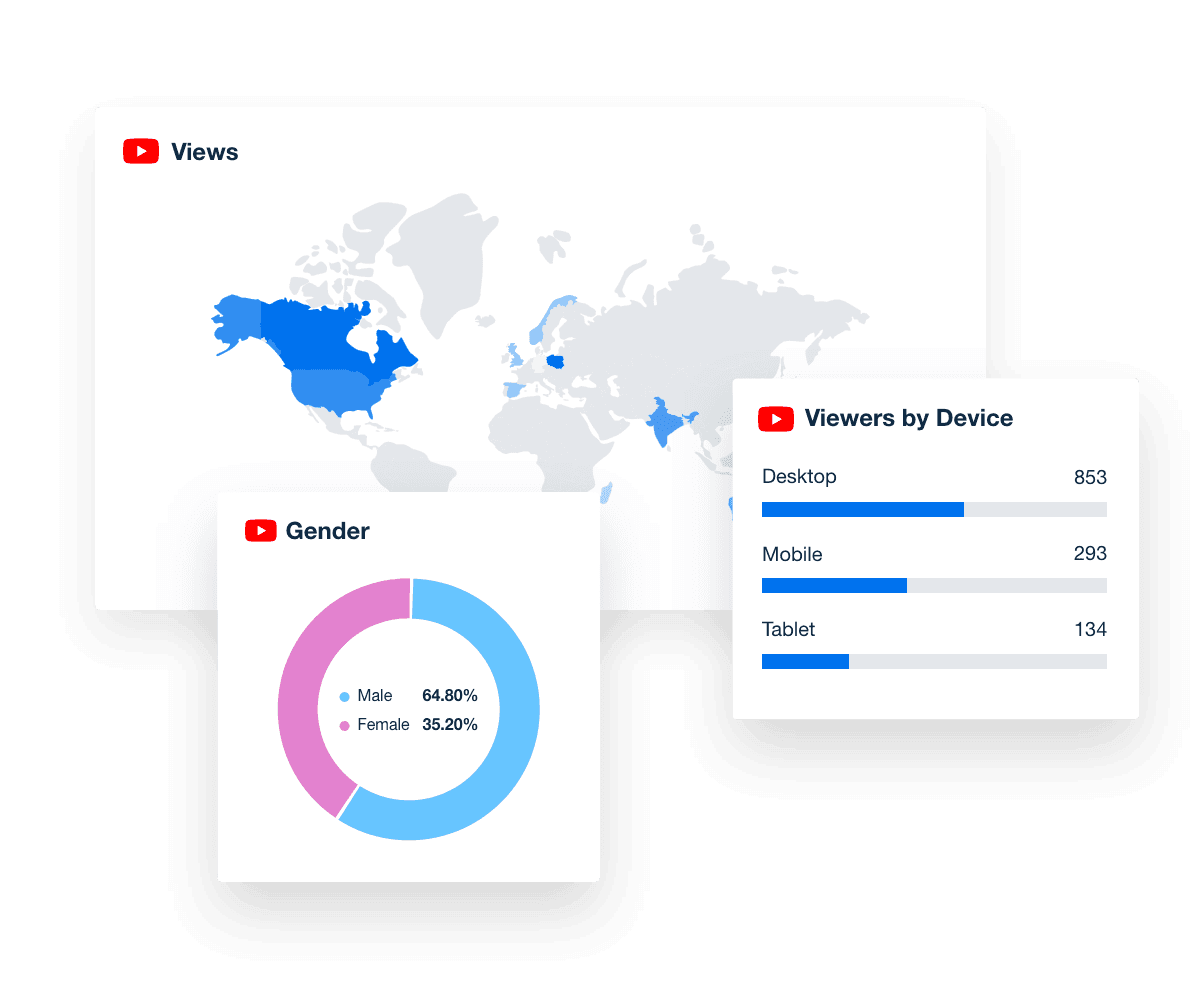
Age, Gender, Location & Device

Know Your Client's Audience

Gain insight into where subscribers are located and what devices they're using. Create content that targets average subscribers' age and gender. With a better understanding of who makes up the YouTube audience, you can continue to deliver engaging content.

View More Ways to Gain Insights
YouTube audience demographics
View More Ways to Gain Insights
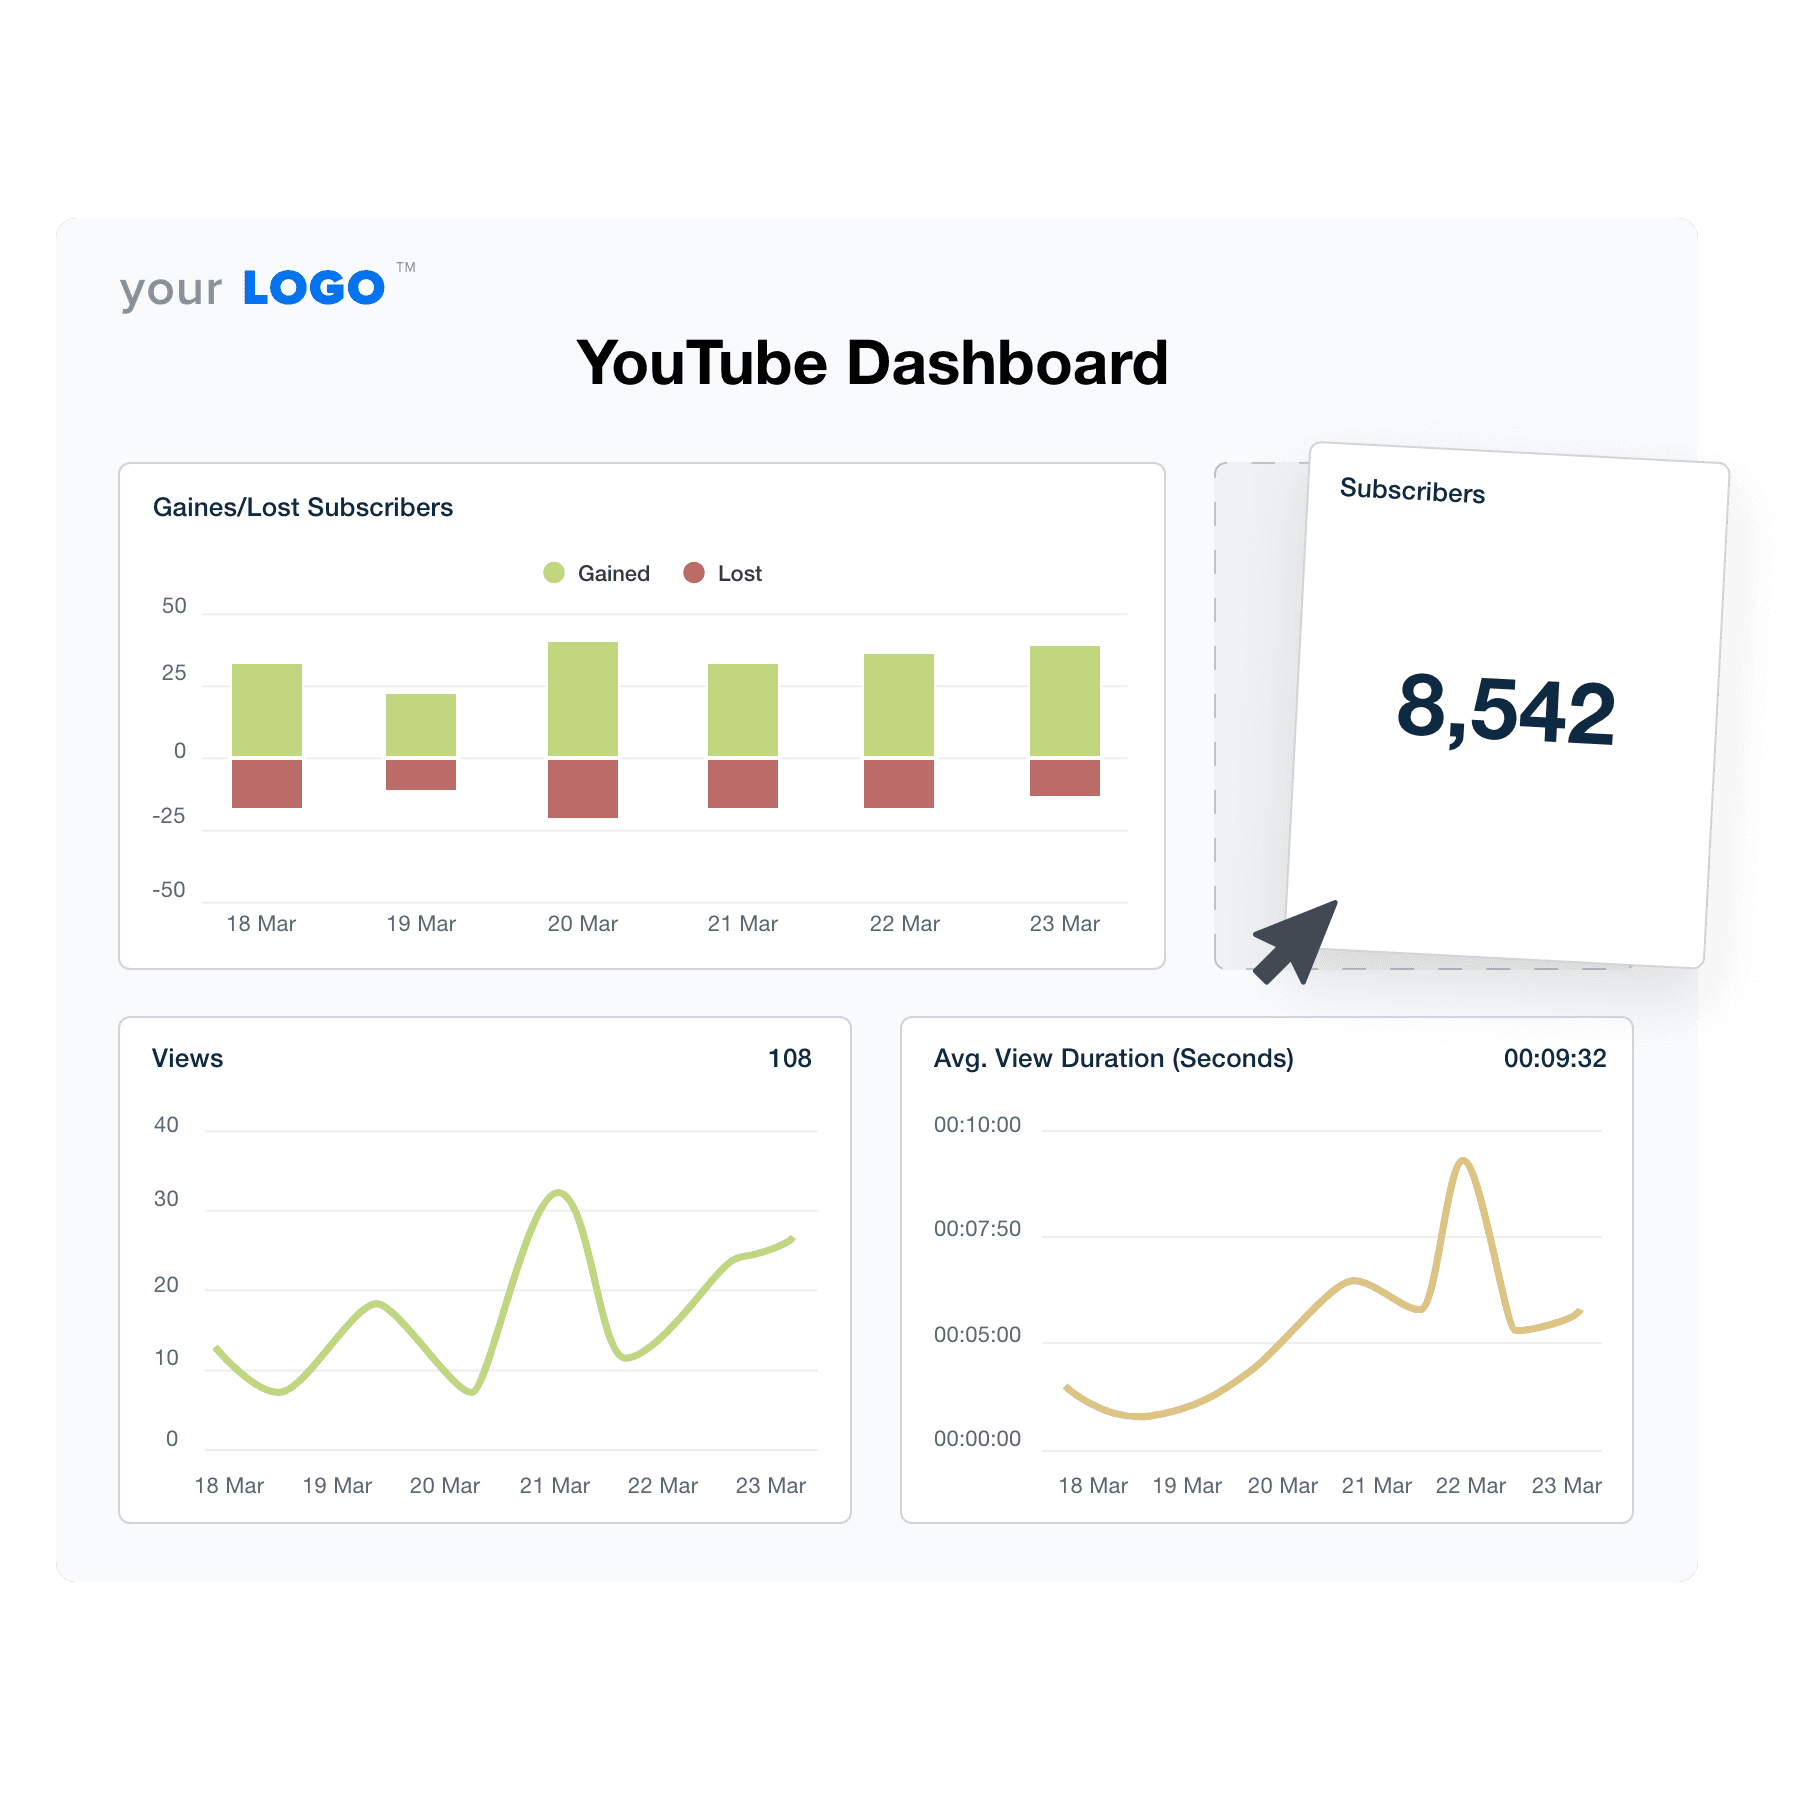
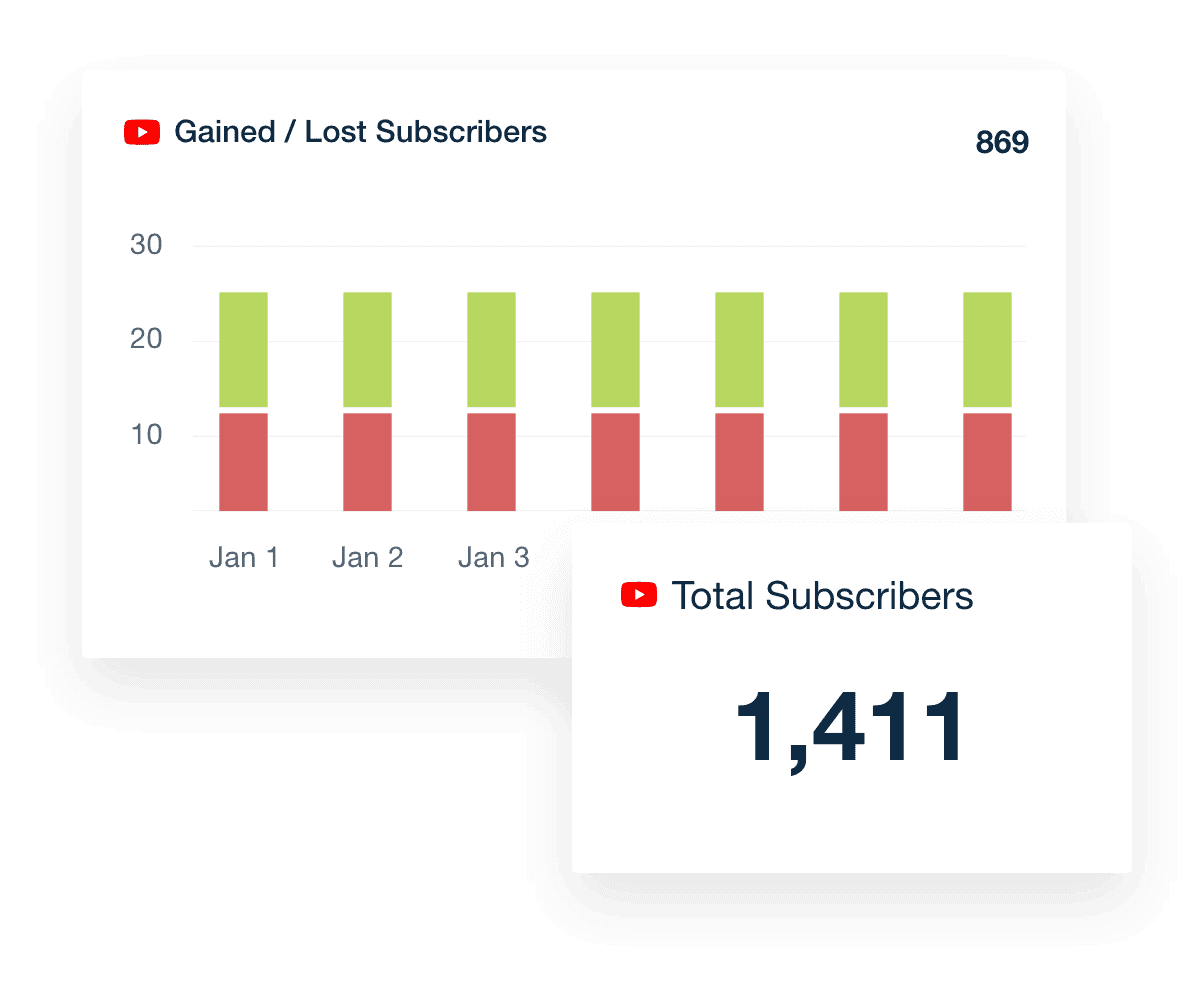
Measure YouTube Channel Growth

Track New & Lost Subscribers

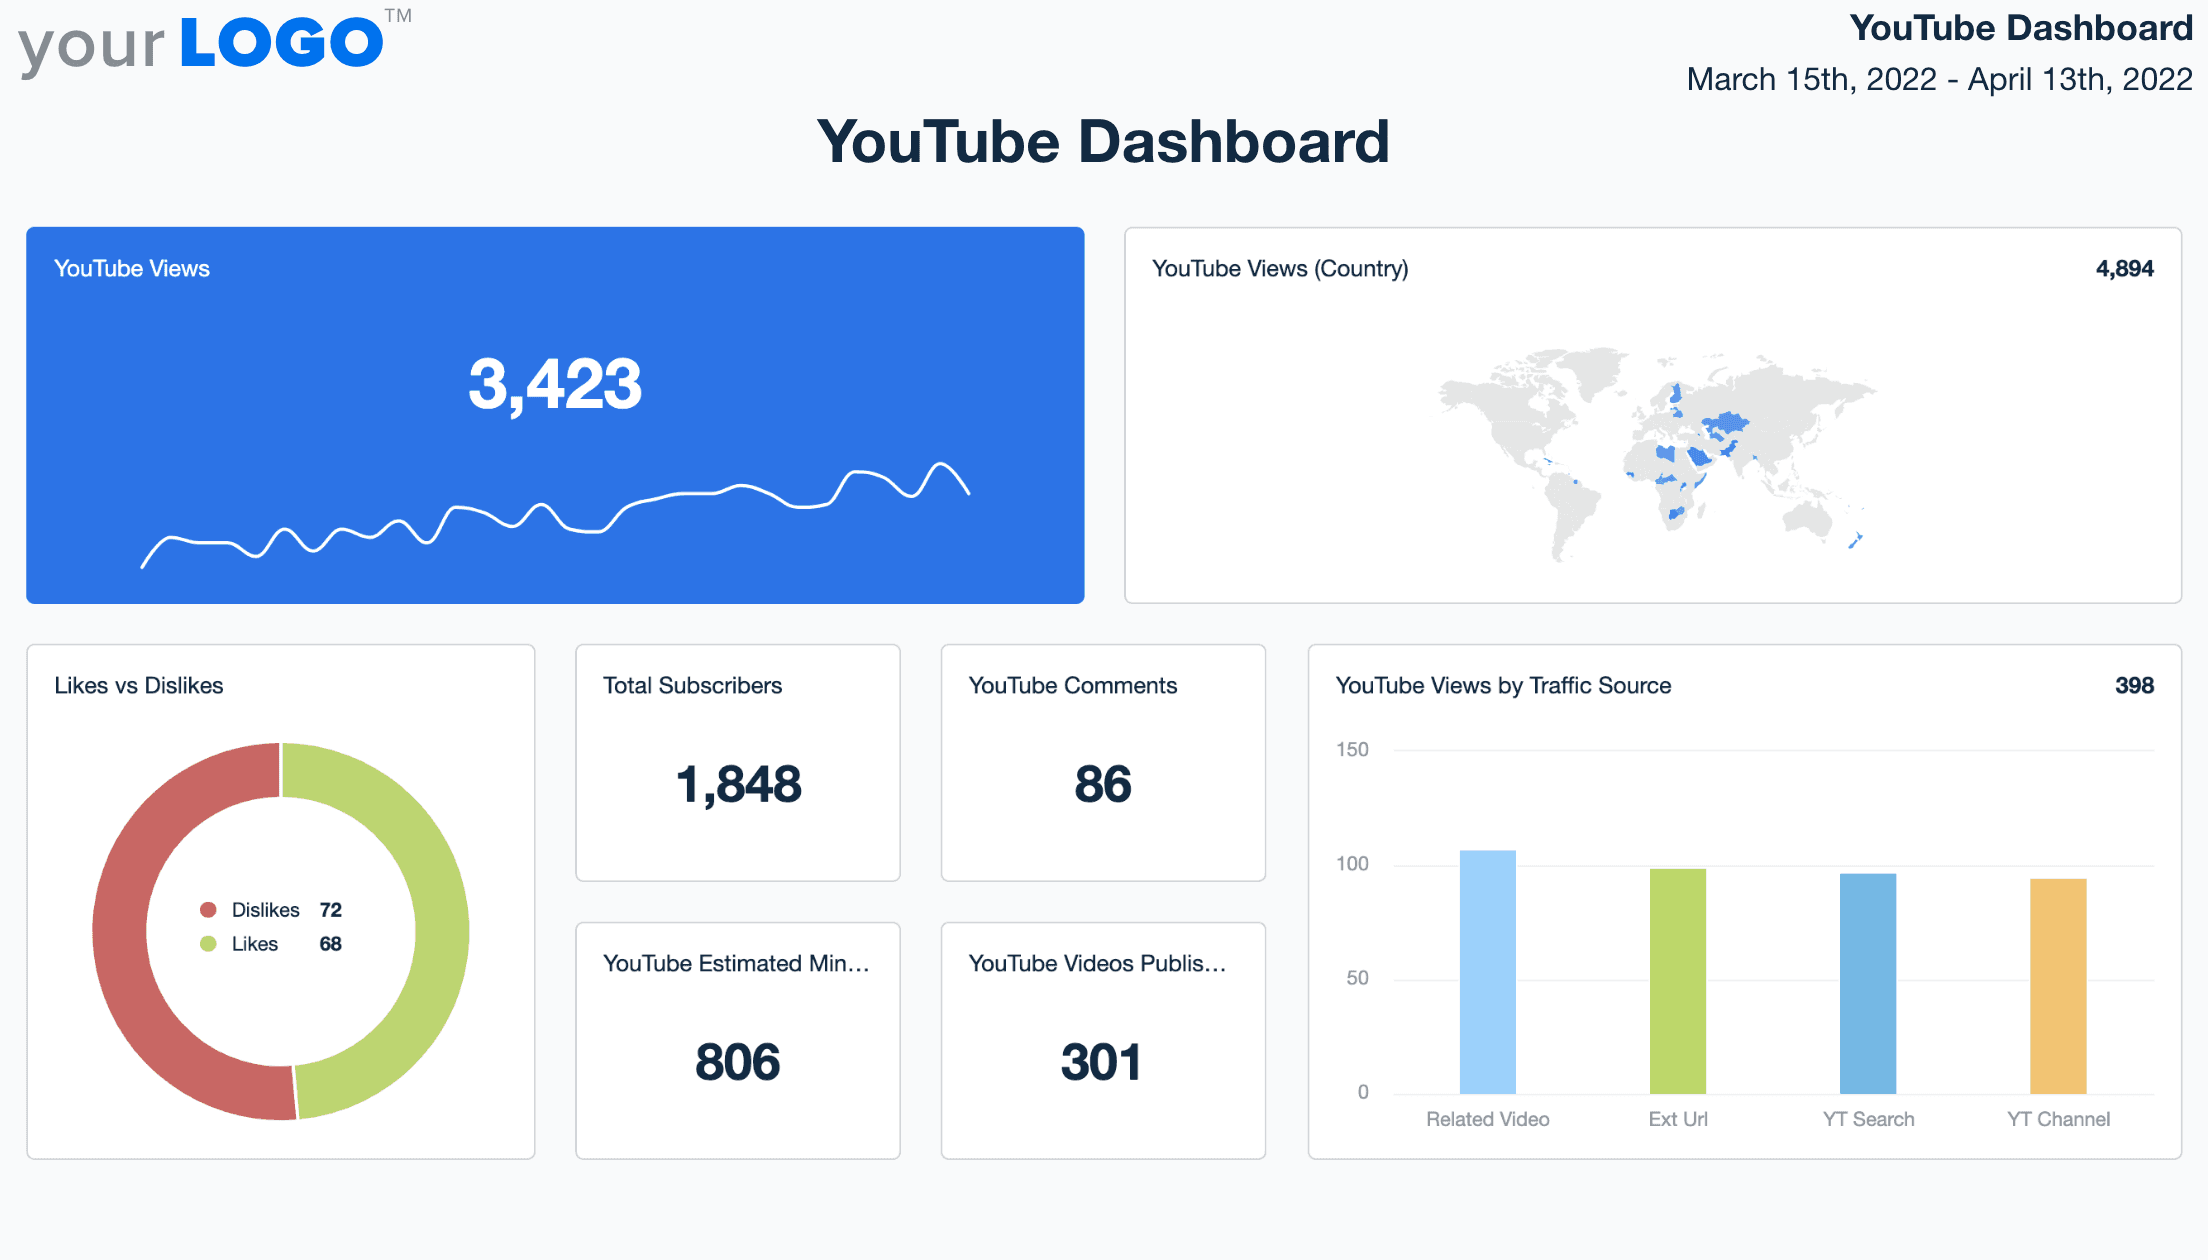
Delight clients with beautiful reports showing their channel's success. Monitor new and lost subscribers month-over-month. Include intuitive graphs in your monthly report, so clients can view their channel history in a single glance.

Easy add comments and annotations to help clients understand trends.

Infuse Expert Commentary
YouTube New & Lost Subscribers metric
Infuse Expert Commentary
INSTANT DATA RETRIEVAL

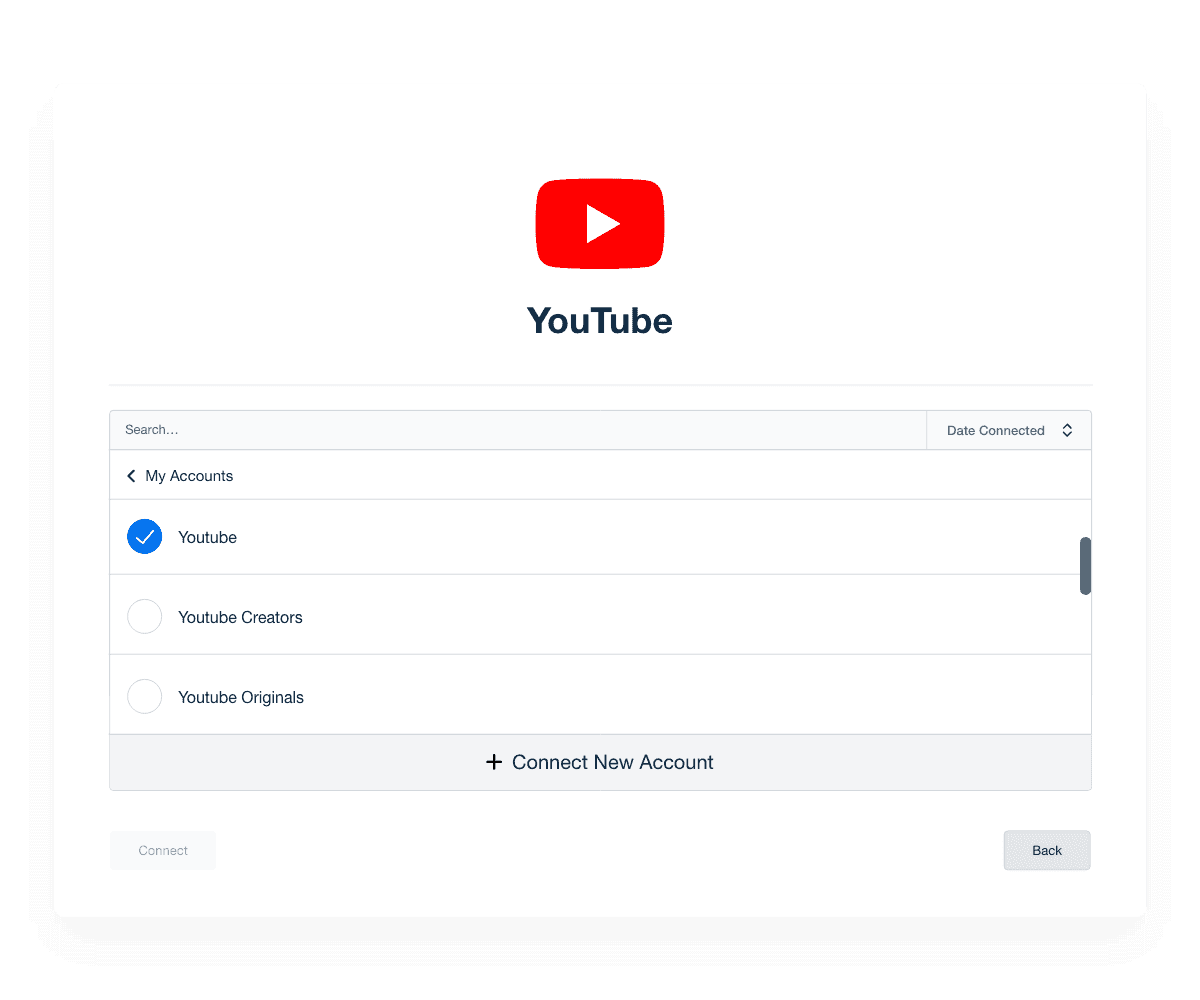
Manage All Your Client YouTube Accounts From One Place

Stop logging in and out of multiple accounts and manage all your clients’ accounts from one streamlined platform. The intuitive YouTube analytics integration automatically retrieves your clients’ YouTube key metrics in real-time and puts them into a visual format that’s easy to analyze. Flip your YouTube dashboard into a comprehensive report in minutes.

Preview Dashboard Template
YouTube account management
Preview Dashboard Template
FULL-PICTURE REPORTING

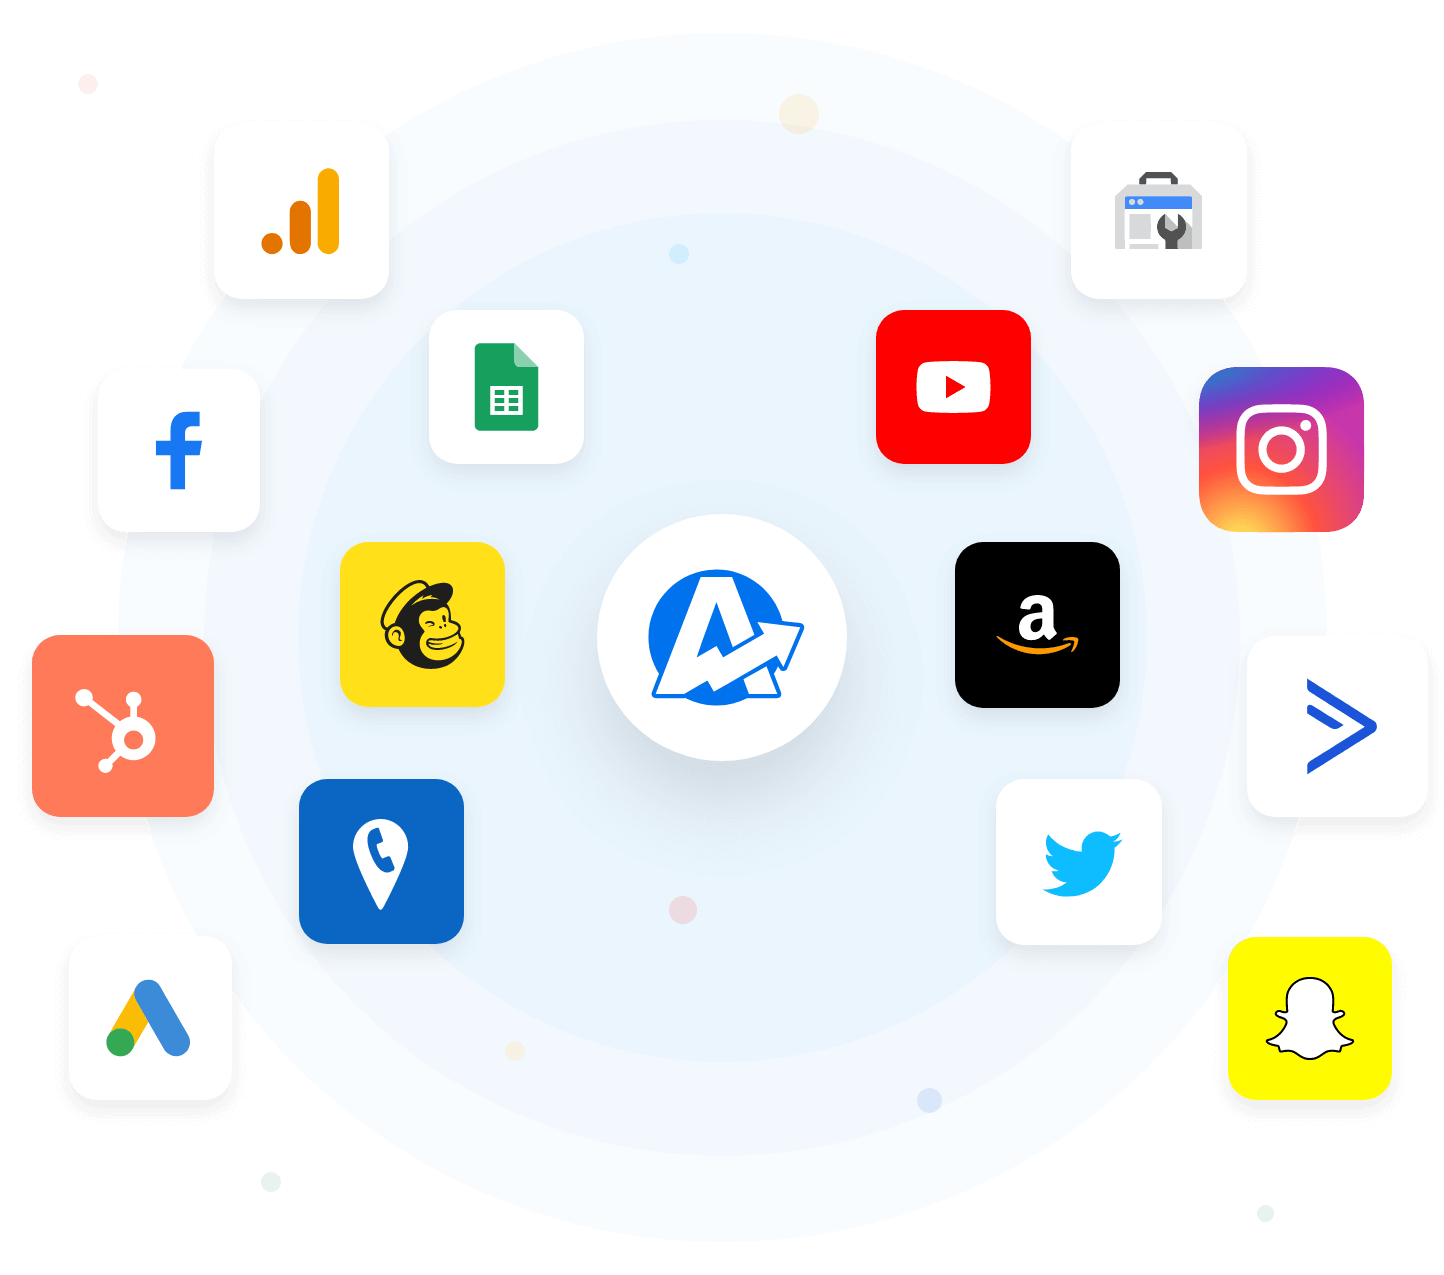
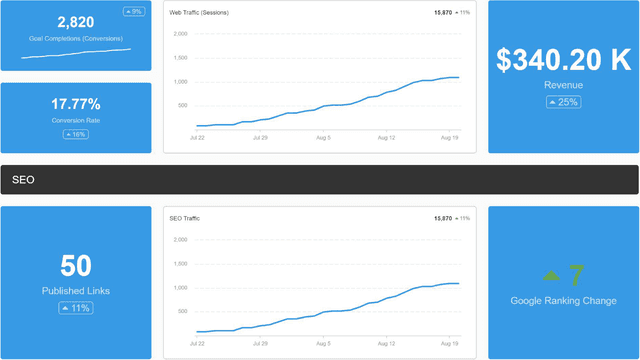
Combine Clients’ YouTube Data With Their Other Marketing Channels

Tired of endless spreadsheets and screenshots from multiple data sources? With over 80 integrations to choose from, including Google Ads, Google Analytics, Facebook, and more... create comprehensive, customizable reports in minutes that show the combined efforts of your agency’s marketing activities. 

Browse Integrations
Example of Available Marketing Integrations
Browse Integrations
YouTube Analytics for Every Video

Automatically Share YouTube Updates with Clients

The YouTube analytics dashboard includes more than just channel trends — it includes insights for every video. Sort the video feed by key metrics to see exactly which videos people engage with.

View Report Automation Options
YouTube video history in Dashboard template
View Report Automation Options

Give Clients Their Own Login

Always keep your clients in the loop about marketing campaigns with a YouTube dashboard that is updated in real-time. Give clients their own login, so they can view live results and analytics whenever they choose.

View All Management Features
Client and Staff User Interface
View All Management Features
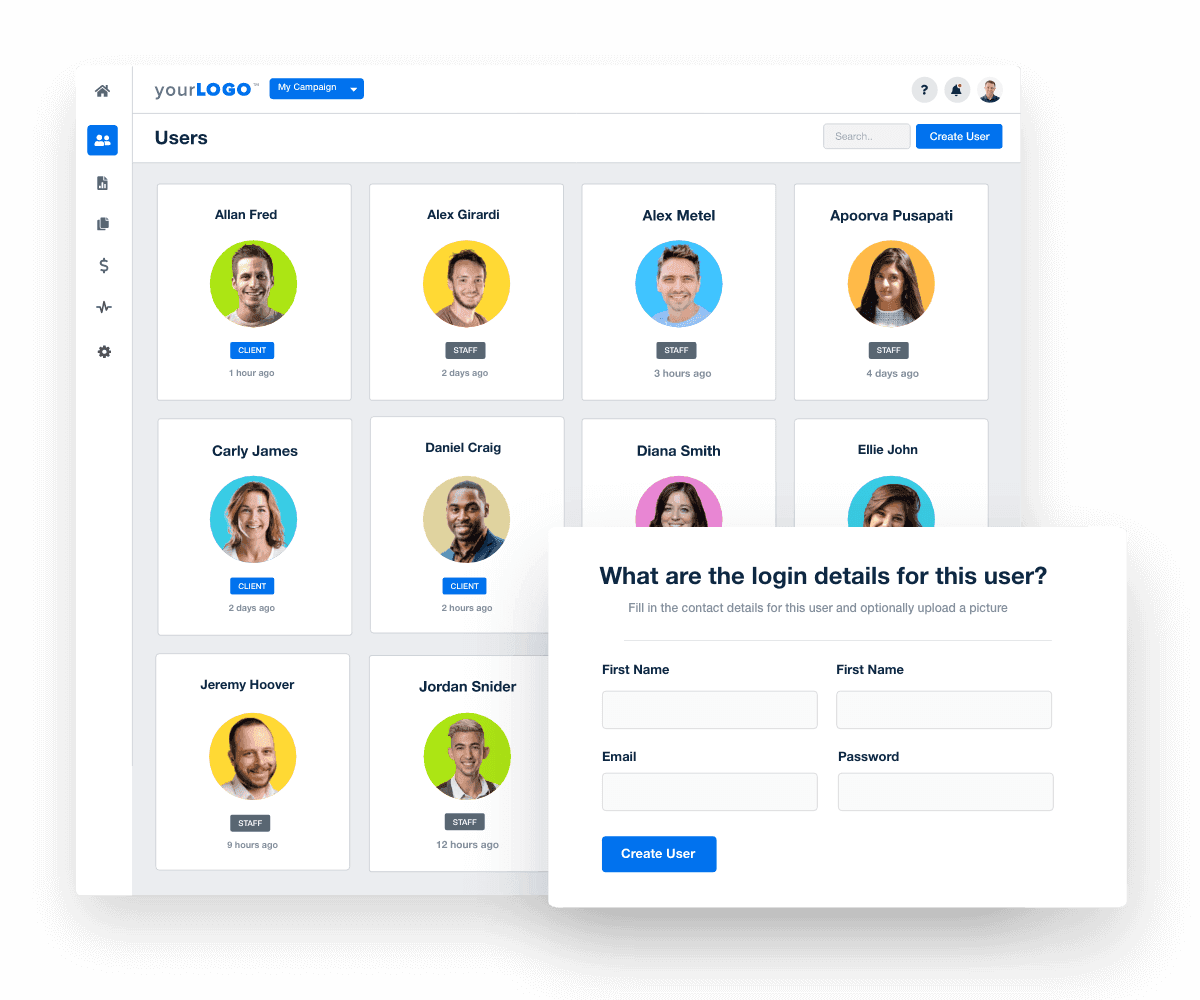
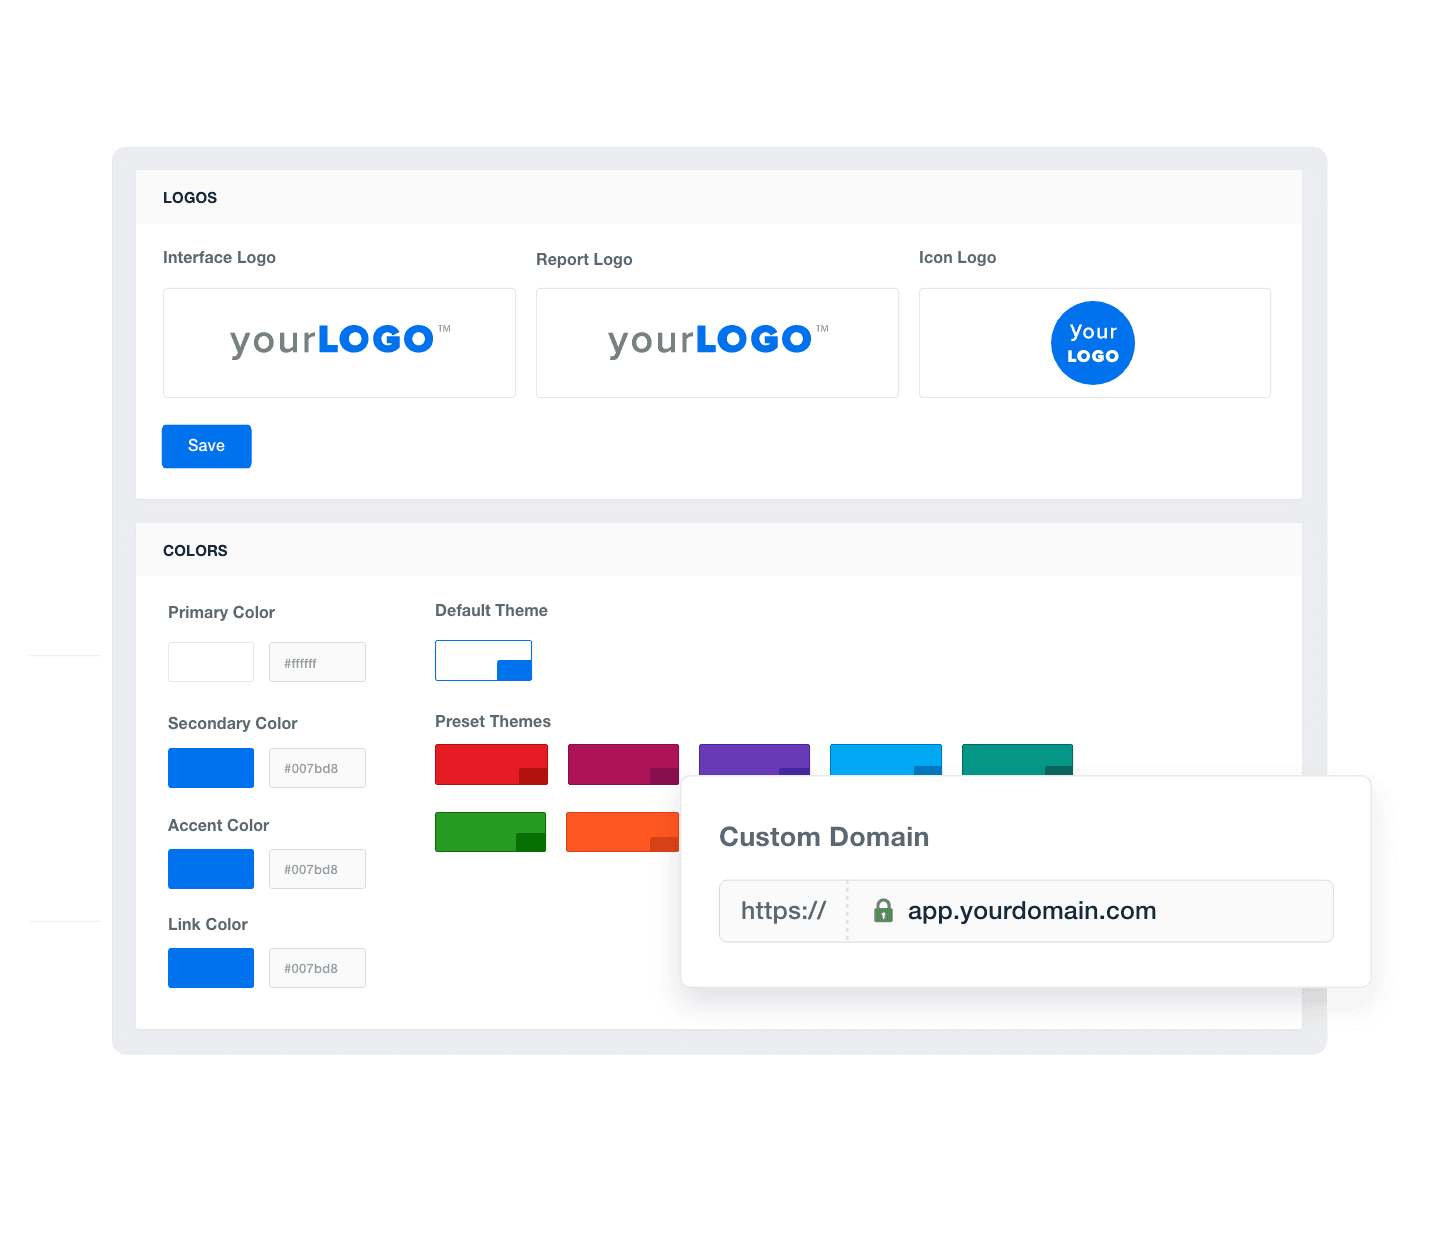
Powerful White Label Options

Add Your Agency Logo & Brand Colors

Take control of your branding with fully white-labeled YouTube dashboards that match your agency’s brand. Upload your agency logo, add your brand’s color palette, and more. With AgencyAnalytics, you have everything you need to call these dashboards your own.

Add Your Agency's Branding
An example of how to add your marketing agency's branding to customizable marketing reporting software
Add Your Agency's Branding

Sign up for your free trial now!

No credit card required. No setup hassle. Just instant access to automated reporting, custom dashboards, and multi-channel insights.

Start Your Free Trial
An icon showing a user clicking to start a free trial
Start Your Free Trial

8 Insight & Metrics To Include in a Youtube Analytics Dashboard

Think of the YouTube dashboard template as a launchpad for your client reporting. It provides a solid structure that easily adapts to fit each client's specific needs. No more building reports from scratch!

The view metric is a self-evident one. It measures the number of times web users have watched certain videos. However, with YouTube, it's a bit more complicated.

YouTube counts a view only when it considers it a legitimate one based on its algorithm. This means that the platform only records views of YouTube content when a user intentionally plays a specific video.

The only problem with this metric is that it can be misleading without other video performance metrics. Creating a video content strategy solely around which types of videos are generating views can be short-sighted.

After all, YouTube views do not mean that users interacted with the video or retained its content. All it shows you is that they chose to click play. While it should be a key metric you look at, pair it with others to get a better picture of what's going on.

When you generate reports for your clients, one of the metrics they are interested in is subscribers. This is because the subscriber metric is one that measures the YouTube channel performance, audience retention, and growth rate. If your subscribers are not increasing it means people are not finding your content relevant or entertaining enough.

When a user subscribes to your channel, it means they have gone beyond just liking or commenting on your videos but have committed themselves to the content you produce.

This metric also helps you to predict future engagement rates as subscribers will engage with the content you put out.

The likes metric in your YouTube Dashboard is another engagement metric. It shows that your audience approves of your content and enjoyed it.

It's crucial to understand that likes help to boost the visibility of your video and rank your videos on search engine results. This will end up being extremely beneficial if you monetize your clients’ videos as visibility increases views.

Monitoring this metric will also help you understand what your audience is looking out for. More likes mean that a lot of users are looking for that kind of content.

The dislike metric is one you would not want to see in high numbers. It means one thing; users do not approve of the content delivered to them. While the dislike count has gone private on YouTube, the button remains there so it’s still a key metric to track.

When measuring this metric, you need to consider the number of likes on the video as well. If you have 200,000 likes and 20 dislikes, it wouldn't make sense to try to change the content delivered because of such few dislikes. Also, keep in mind that most videos will get a certain number of dislikes so this piece of YouTube data should be taken with a grain of salt.

YouTube views metric on a dashboard

Build YouTube analytics dashboards that deliver results

Save time and impress clients with a powerful, results-driven dashboard template. Access the free YouTube analytics dashboard template today!

Preview the Dashboard
Illustration of a user at a marketing agency trying the client reporting features from AgencyAnalytics
Preview the Dashboard

Comments are a high-level engagement metric as they go beyond just clicking the like button or simply hitting play. They tell you that users found the content you delivered to them engaging enough to talk about.

In analyzing comments, you also want to keep an eye on this one to get a feel of what the consensus of your audience is about the content. When a video has a lot of positive comments, try to replicate the content in a unique way as it's a clue that your users want more of it.

When generating a social media or YouTube report for clients, one of the main deliverables will usually be videos published. This should be a key number that you show your clients and allow them to delve further in via the dashboard to see exactly what videos were put up.

It's important to show the publishing frequency and monitor how many videos are being put out on a monthly basis. To dig into the performance of specific videos, head over to the Videos tab to see the top metrics for each published video, including publication date, views, likes, and dislikes.

If your goal is to rank your videos high on search engines, then the estimated minutes spent watching the videos you create should be of prime importance. This watch time metric measures the average time web users spend watching the videos.

When videos accumulate a high number of minutes watched, they are more likely to be recommended to new viewers and appear in organic search results. This metric also reflects the overall consumption of video content, indicating how engaging and effective it is at retaining viewers' attention.

Shares are another critical metric to focus on in order for you to understand if your audience is interested in engaging with your content. Users watching your content is one thing but sharing your videos with other users is a whole new level of engagement

Use your customizable YouTube dashboard to monitor this metric and get a clear understanding of your campaign’s engagement level. Flip this dashboard into bespoke client reports to help you, and your client, make data driven decisions.

YouTube Comments Graph Example

FAQs About Custom YouTube Dashboards

Still have questions about how to create and use custom YouTube Dashboards? Don’t worry, we’ve got you covered.

  • A YouTube Dashboard gives agencies a live view of their client’s channel performance. It pulls channel analytics from the client’s YouTube Account and displays performance data like views, likes metric, average view duration, and subscribers gained. Agencies use the dashboard to assess what’s working across YouTube Videos and improve their clients’ video strategy.

  • Build a white label YouTube Dashboard using AgencyAnalytics. Connect the client’s YouTube Account, choose the performance metrics that matter, and apply your agency’s branding. Customize the layout and metrics to create a professional YouTube Report clients can access with zero confusion.

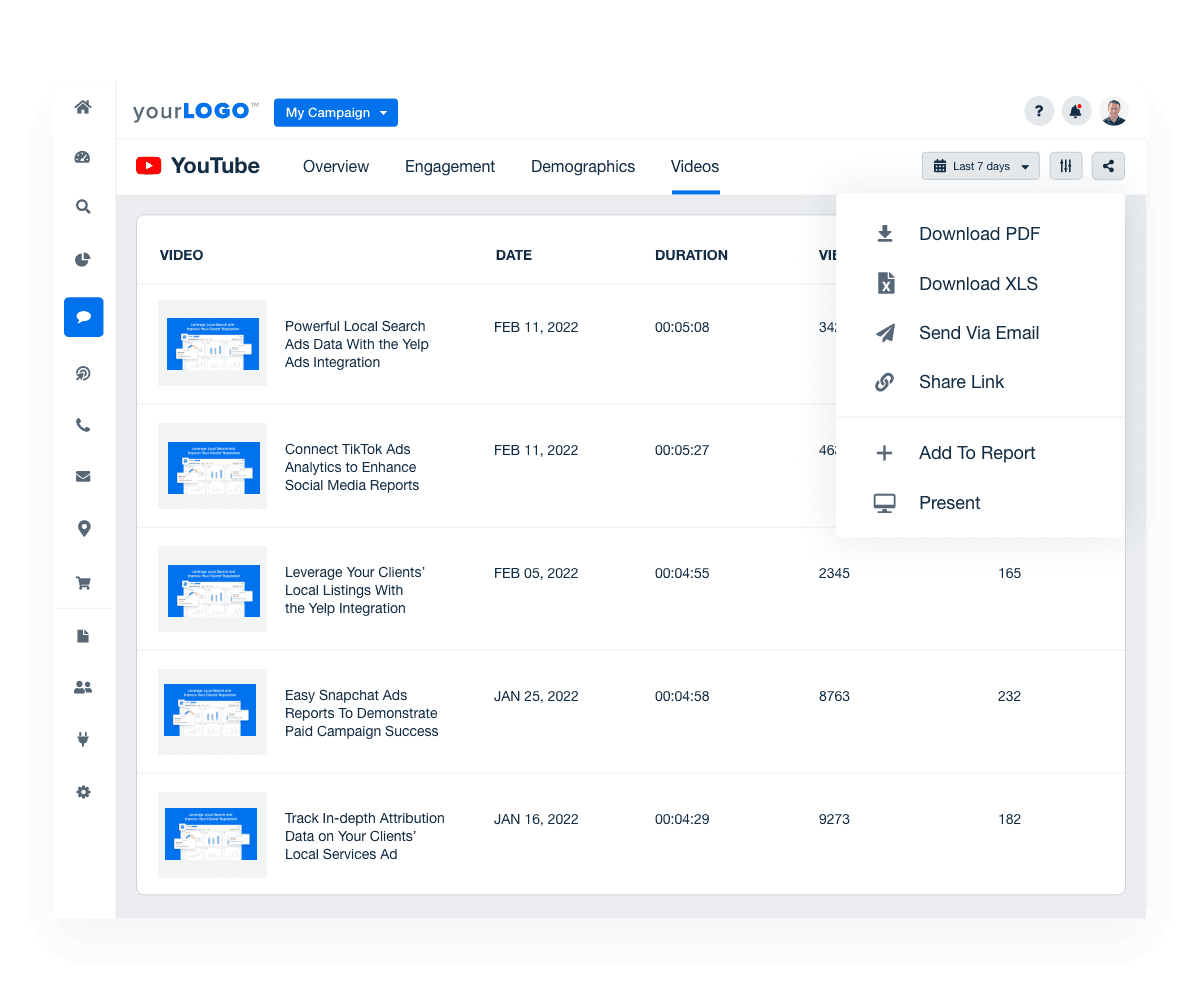
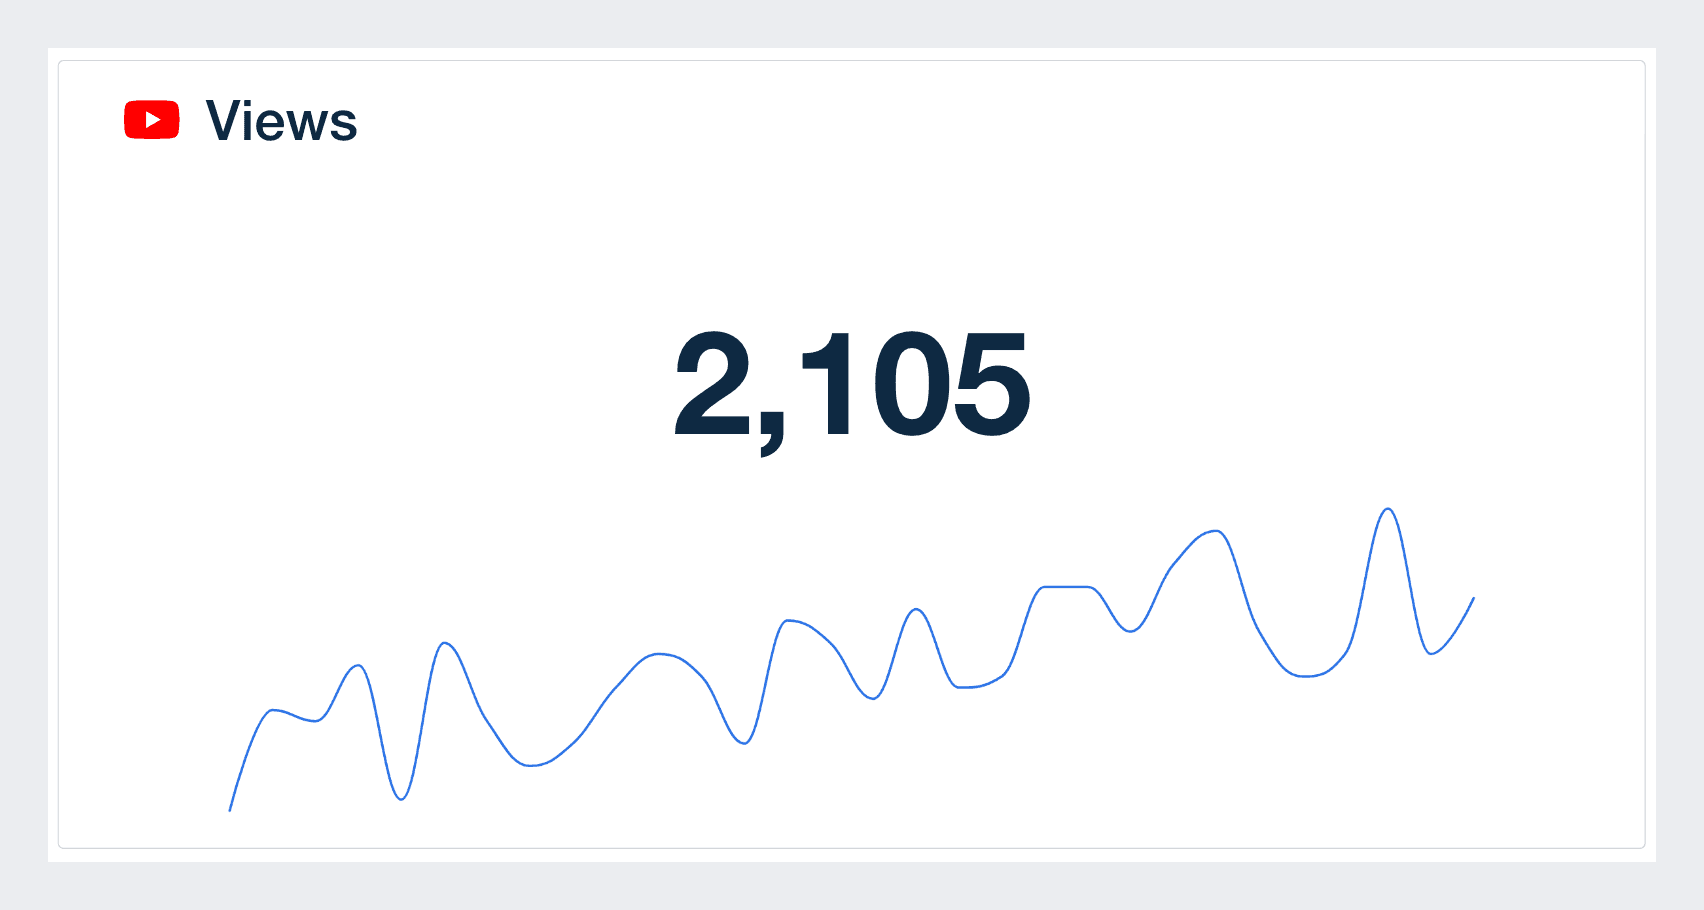
  • Track average view duration, subscribers gained, top videos, and total number of views. Use filters to highlight metric measures across different platforms and traffic sources. Look at viewers’ behavior for specific videos to understand how long they’ve spent watching and what’s driving new subscribers.

  • A YouTube Dashboard replaces spreadsheets with visual, filterable data. Agencies build reports faster, reduce manual work, and save hours by automatically pulling channel analytics into one place. This keeps other users on your team aligned and makes it easier to deliver insights backed by accurate performance data.

  • A YouTube dashboard provides detailed analytics on various video metrics, helping agencies identify high-performing content, audience preferences, and optimal posting times. This insight supports data-driven adjustments to content strategies, maximizing engagement and return on investment for clients.

  • A custom YouTube Dashboard gives agencies more flexibility than the YouTube Studio App. Instead of toggling between different platforms to get the full picture of your client's digital marketing performance, access a centralized view that highlights key insights like traffic sources, average amount of time spent watching, and how performance shifts after publishing a new video.

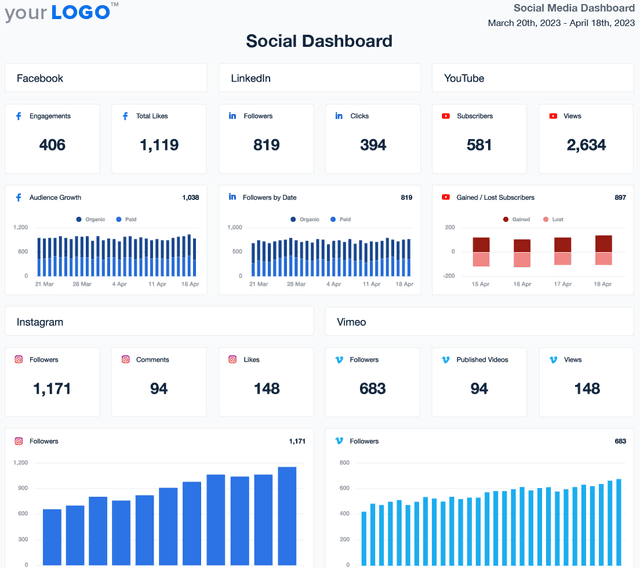
  • Yes. Customize the dashboard by selecting key metrics, organizing videos by title or performance, and filtering by campaign. Whether you're reporting on the total amount of video views or likes metric across Facebook Pages, Instagram, TikTok, and YouTube, the dashboard makes it easy to tailor insights to client goals.

  • Top dashboard choices include the SEO dashboard for SEO insights, the social media reporting dashboard to present social media analytics, and the PPC dashboard to showcase PPC outcomes. Agencies often finalize reports using the digital marketing dashboards for digital marketing summaries and the website analytics dashboard to capture web analytics performance.

More templates

Digital Marketing Dashboard Template Example

Digital Marketing Dashboard

Bring all your client’s digital marketing metrics together in one place. From SEO and PPC to social and email, a customizable dashboard makes reporting faster and clearer—for both your agency and your clients. Join over 7,000 successful agencies and experience the benefits of using a customizable digital marketing dashboard!
A screenshot of an example ecommerce dashboard

Ecommerce Dashboard

Track sales, conversion rates, PPC performance, and SEO in a fully customizable ecommerce dashboard. Consolidate key metrics in one place, automate reporting, and provide clients with live insights to optimize their online store’s growth. Find out why over 7,000 successful agencies choose AgencyAnalytics to save time, boost profitability, and keep clients on the path to growth.
Social Media Dashboard Template Example

Social Media Dashboard

Track engagement, reach, clicks, and conversions across Facebook, Instagram, LinkedIn, YouTube, and more—all from one customizable social media analytics dashboard. Deliver live insights, save time, and keep clients aligned with your agency’s strategy. Join over 7,000 satisfied customers and experience the benefits of using a social media dashboard!
View All Templates

See how 7,000+ marketing agencies help clients win

Start Your Trial Now

Free 14-day trial. No credit card required.

Callout Get StartedSwoosh
Logo
G2 Users Love Us
AgencyAnalytics - G2 Leader Winter 2026
AgencyAnalytics - G2 Momentum Leader Winter 2026
G2 Crowd

4.7 out of 5

Capterra

4.8 out of 5

Product
Platform features
Agency solutions
Data integrations
Compare platforms
Reviews
Pricing
Company
About
Careers
Hiring
Media Kit
Contact
Get Started
Start Free Trial
Book a Demo
Quick Start Guide