AgencyAnalytics
AgencyAnalytics
  • Pricing
  • Login
  • Start Trial

Google Analytics Report Template for Fast, Actionable Insights

Turn Google Analytics data into reports that clients understand. The customizable Google Analytics Report Template simplifies web traffic, conversions, and user behavior into insights that tell a real story—not just a list of numbers.
Preview TemplateStart Your Free Trial
Google Analytics 4 report template example

Customizable Google Analytics Report Templates That Keep Clients Informed

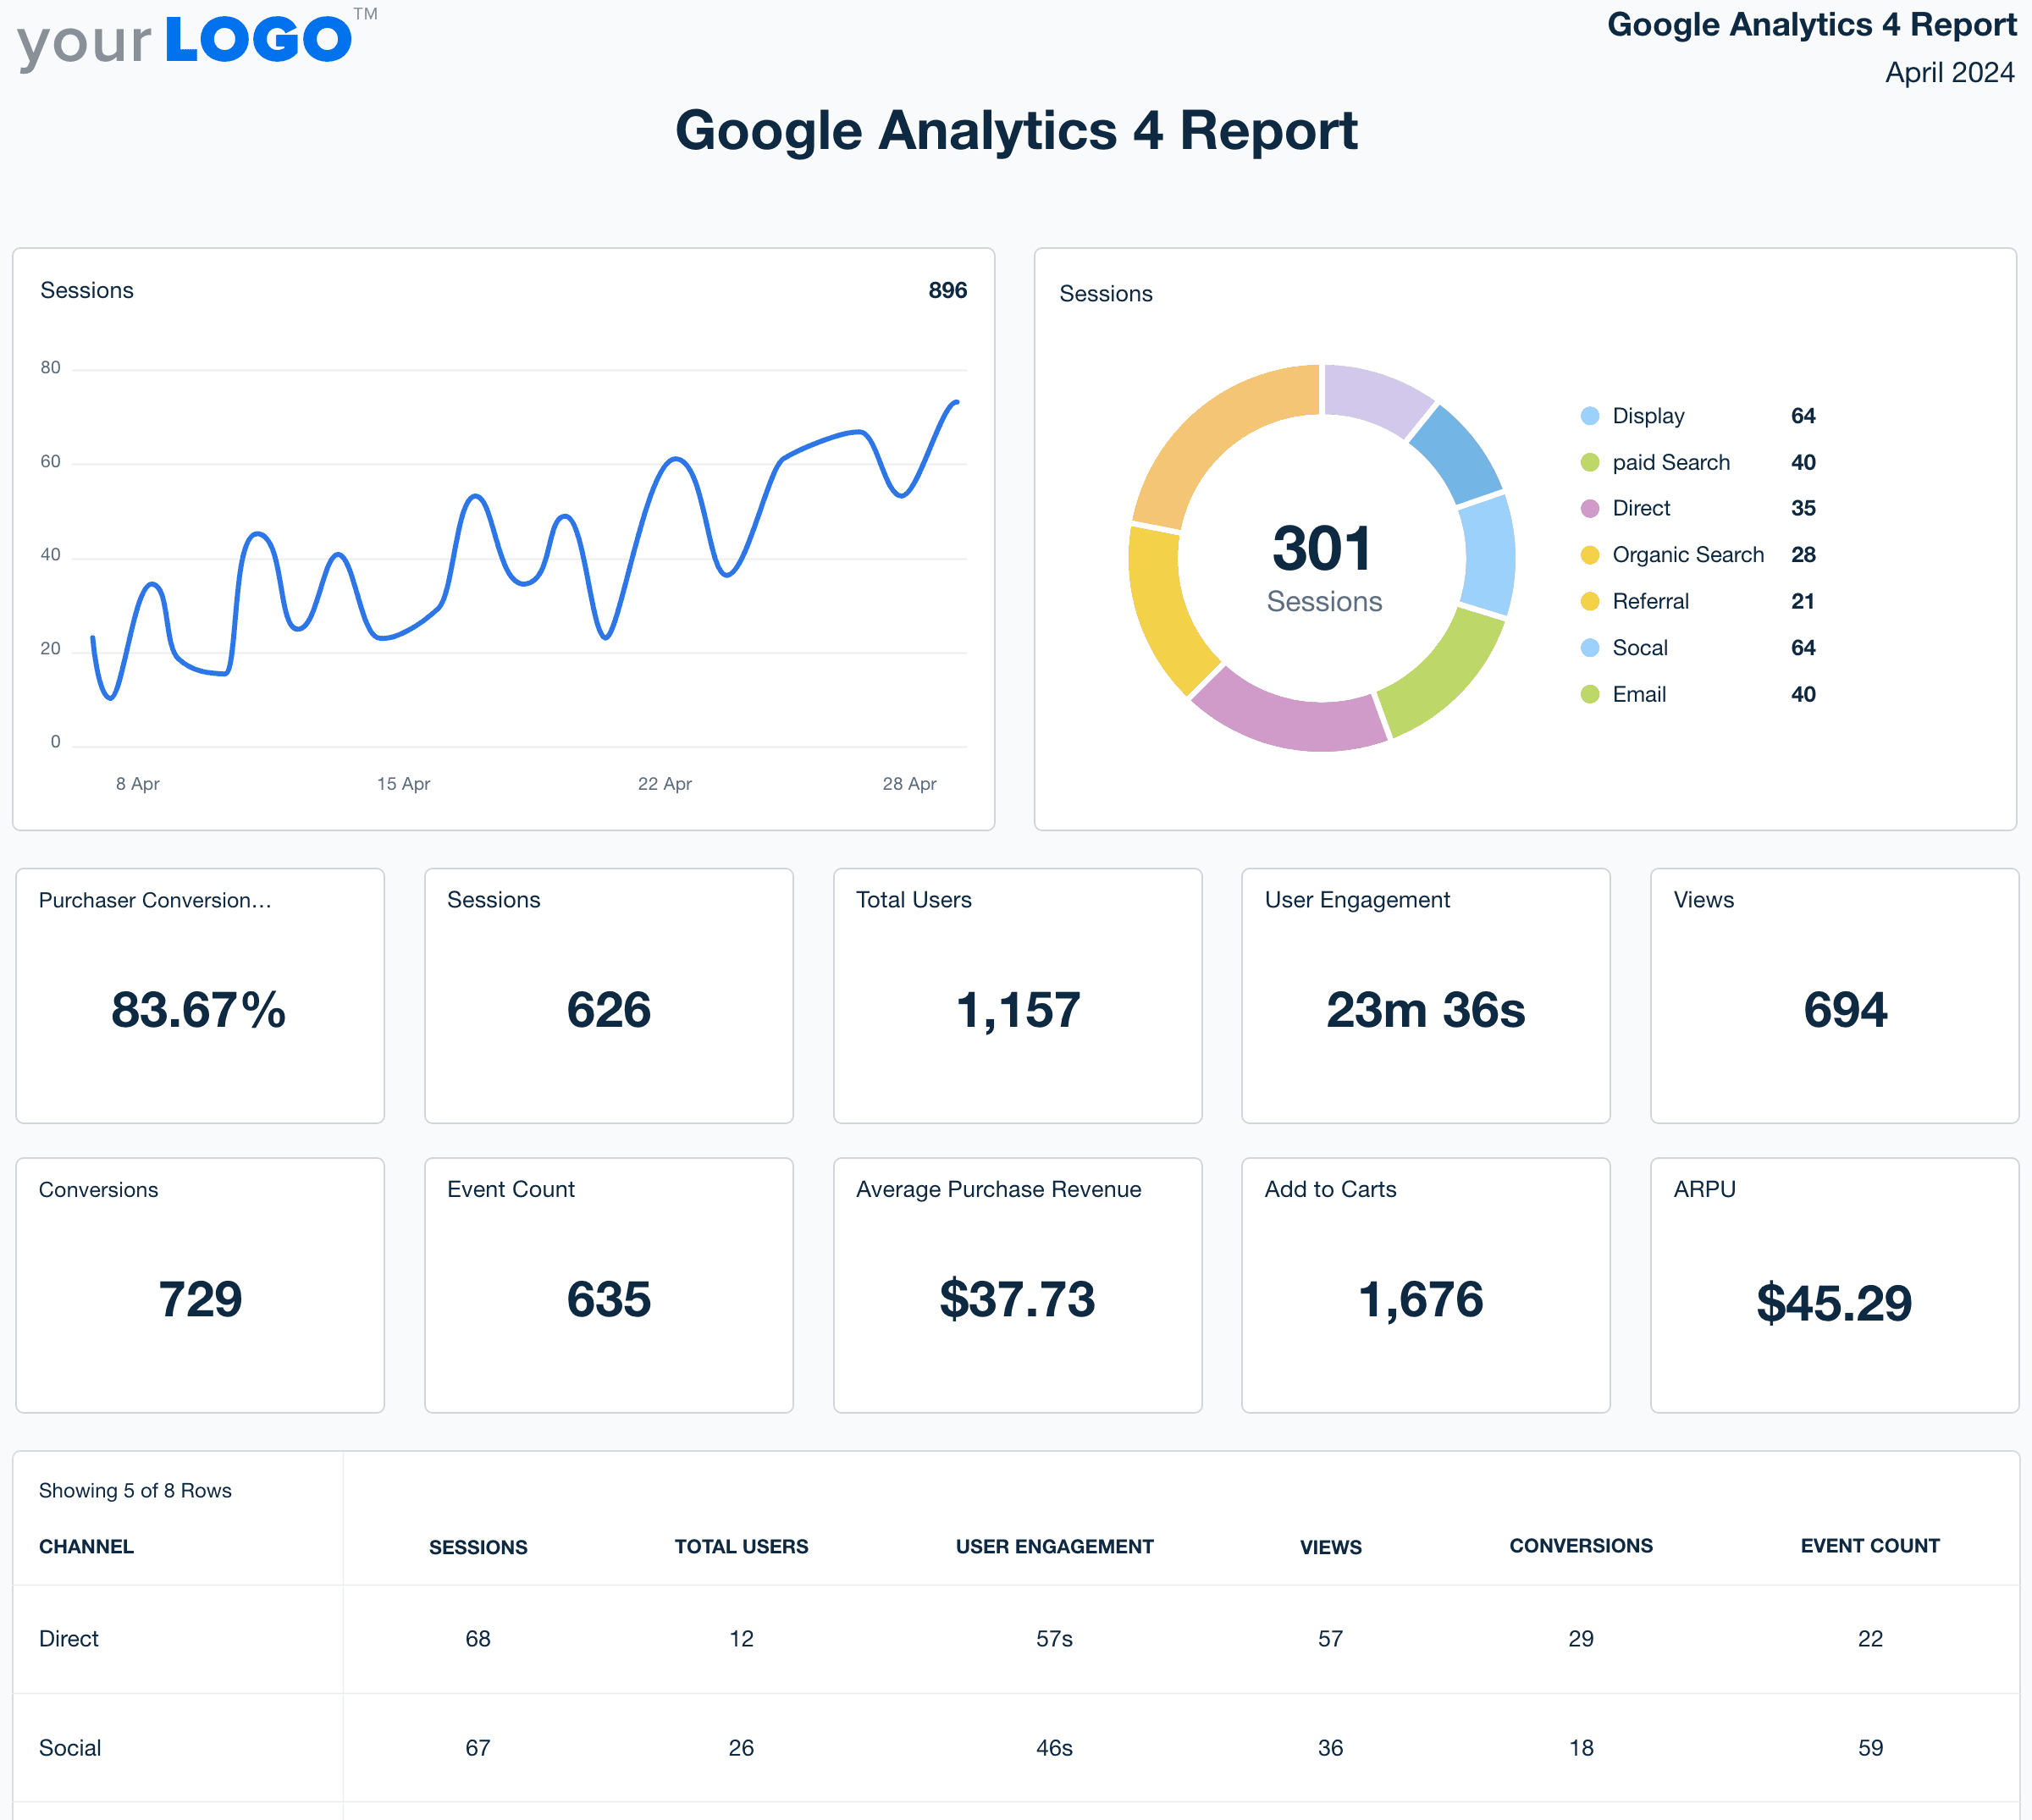
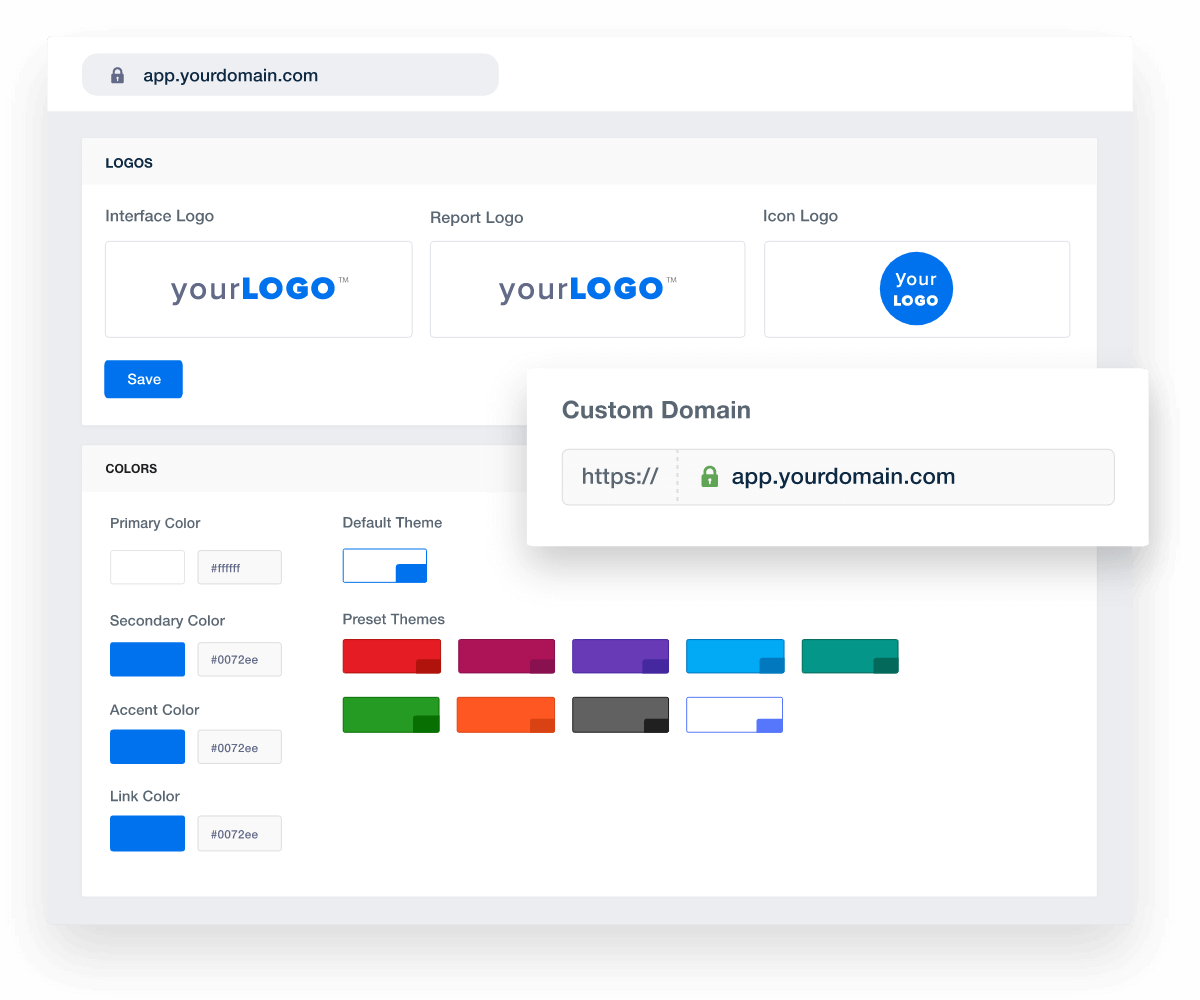
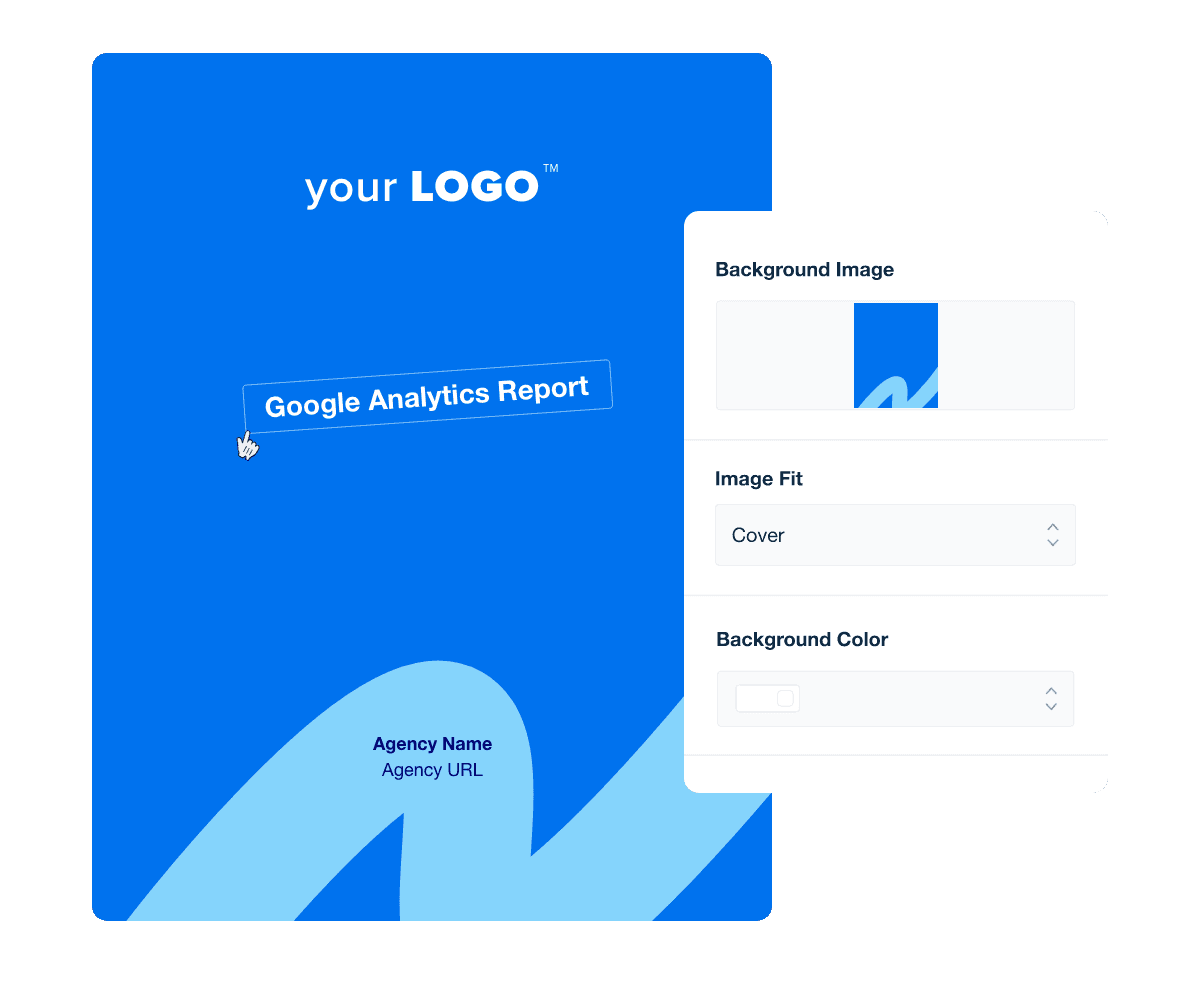
Skip the complexity of raw GA dashboards and deliver clear, client-ready reports in minutes. Automatically pull in key website metrics, customize layouts to highlight traffic trends, conversions, and user behavior, and apply white-label branding for a polished, professional look.

Templates pull live data from 80 marketing platform integrations, reducing manual work and helping clients understand how their site performance ties directly to your agency’s strategy.

Create Professional Google Analytics Reports in Minutes
An illustration of the drag-and-drop Google Analytics report template builder
Create Professional Google Analytics Reports in Minutes

Easily Report on Your Client's Google Analytics

Start Your Free Trial

Custom Google Analytics Reports as Unique as Your Agency

GOOGLE ANALYTICS DATA MADE EASY

Automated Google Analytics Reports

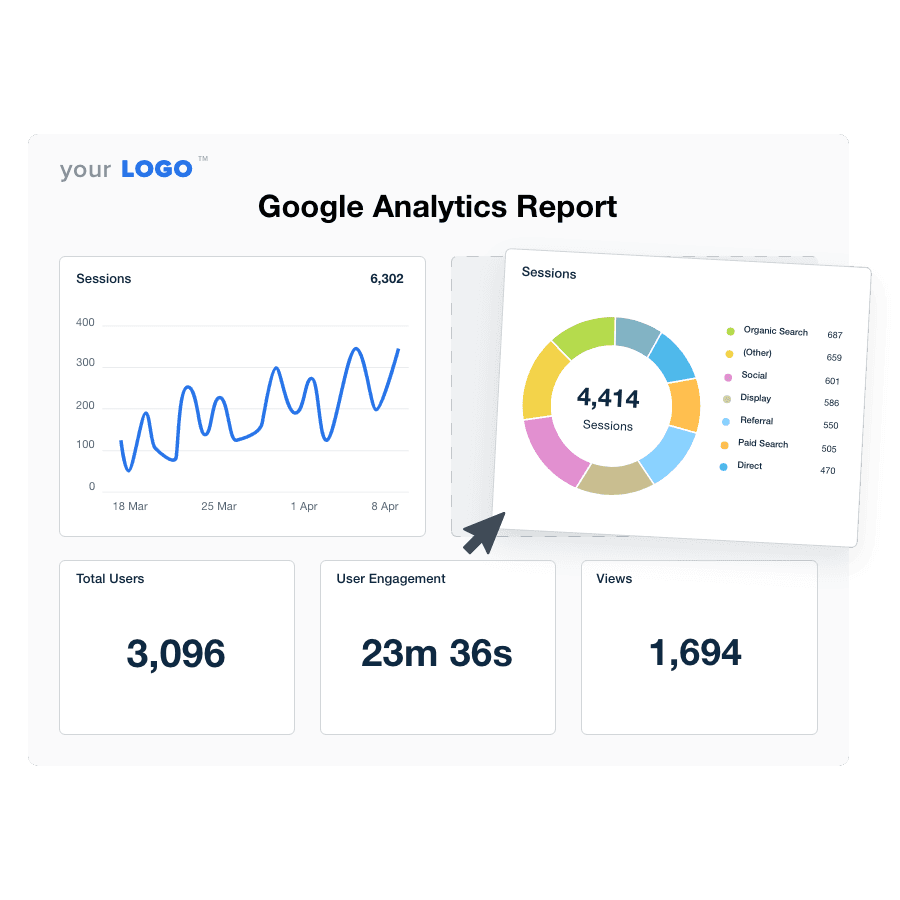
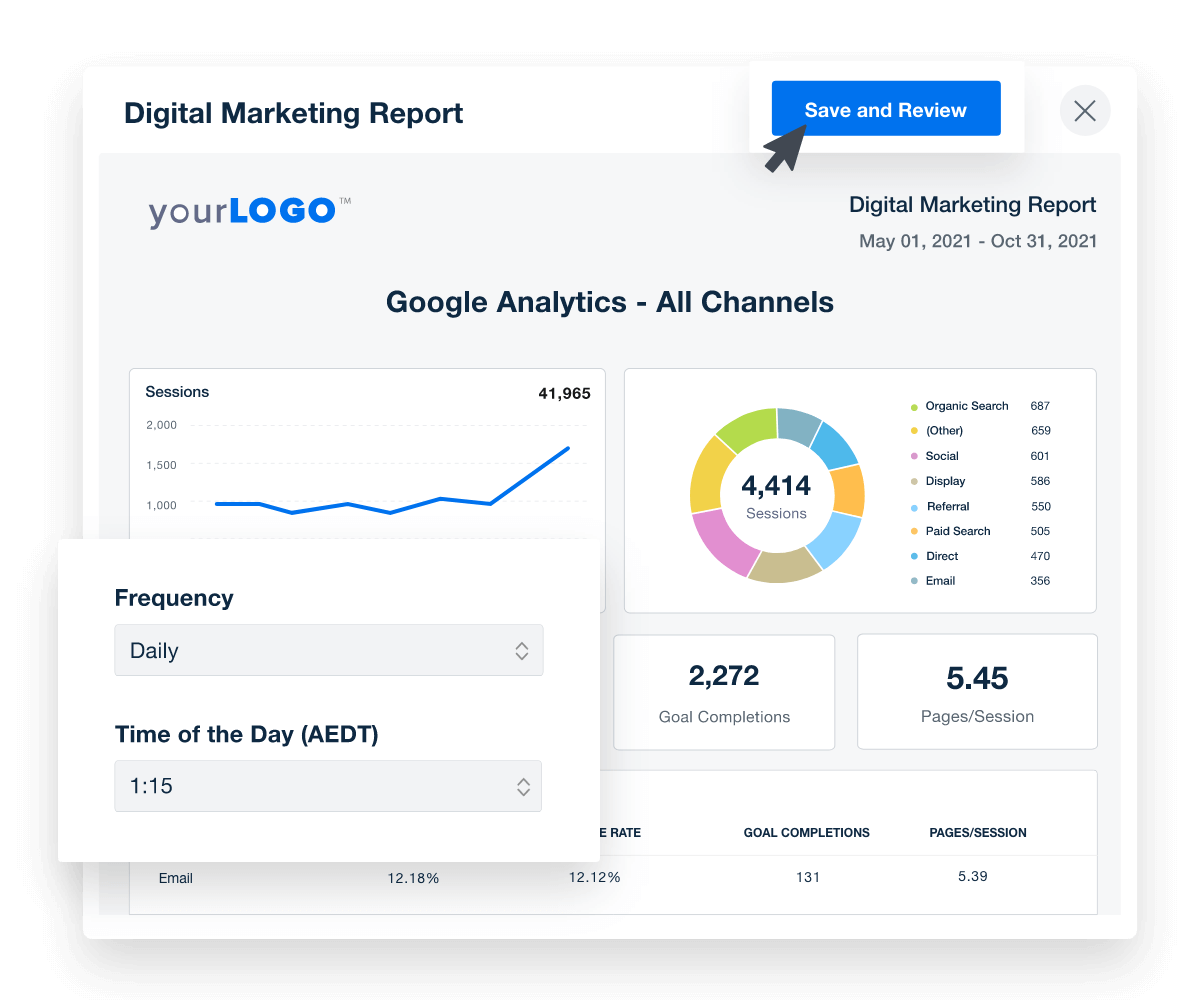
Create insightful Google Analytics reports in minutes! The streamlined report builder helps you pull in all your clients' key metrics to show your agency's true impact. Schedule your reports to go out ahead of time and they'll automatically get sent with your clients' latest data.

Get Started With Automated Reporting
A screenshot of report scheduling and approval options
Get Started With Automated Reporting
80+ INTEGRATIONS

Combine Google Analytics Data With All Your Other Marketing Channels

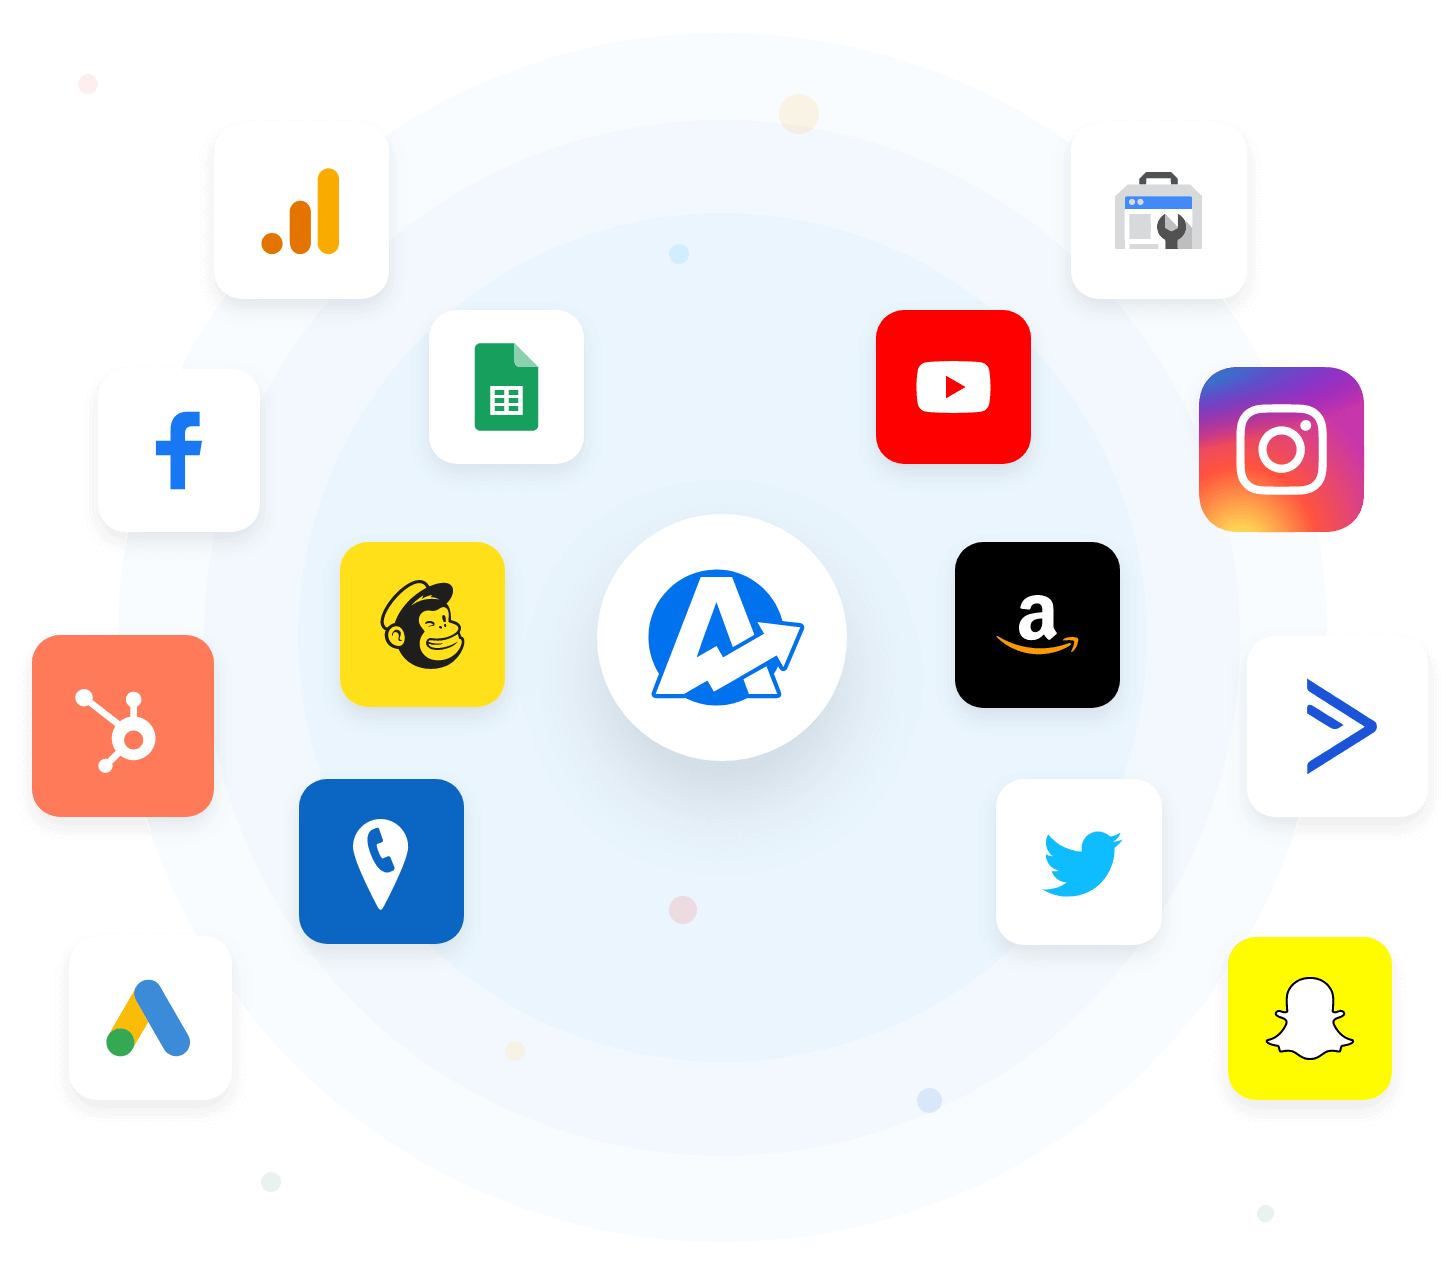
Unify metrics from the Google Analytics 4 integration and pull data from 80+ marketing platforms, including Google Ads, Facebook, Google Search Console, and more! Consolidate insights into a single dashboard or report–all in a few clicks. No more logging in and out of multiple platforms for each client. Create in-depth client reports with all their data pulled into one streamlined platform.

A comprehensive digital marketing report template consolidates all your client's data into one centralized hub, driving efficiency, improving targeting, and maximizing conversions.

Explore All Available Integrations
Example of Available Marketing Integrations
Explore All Available Integrations
AI Insights That Drive Results

Turn GA Data into Insights in Seconds

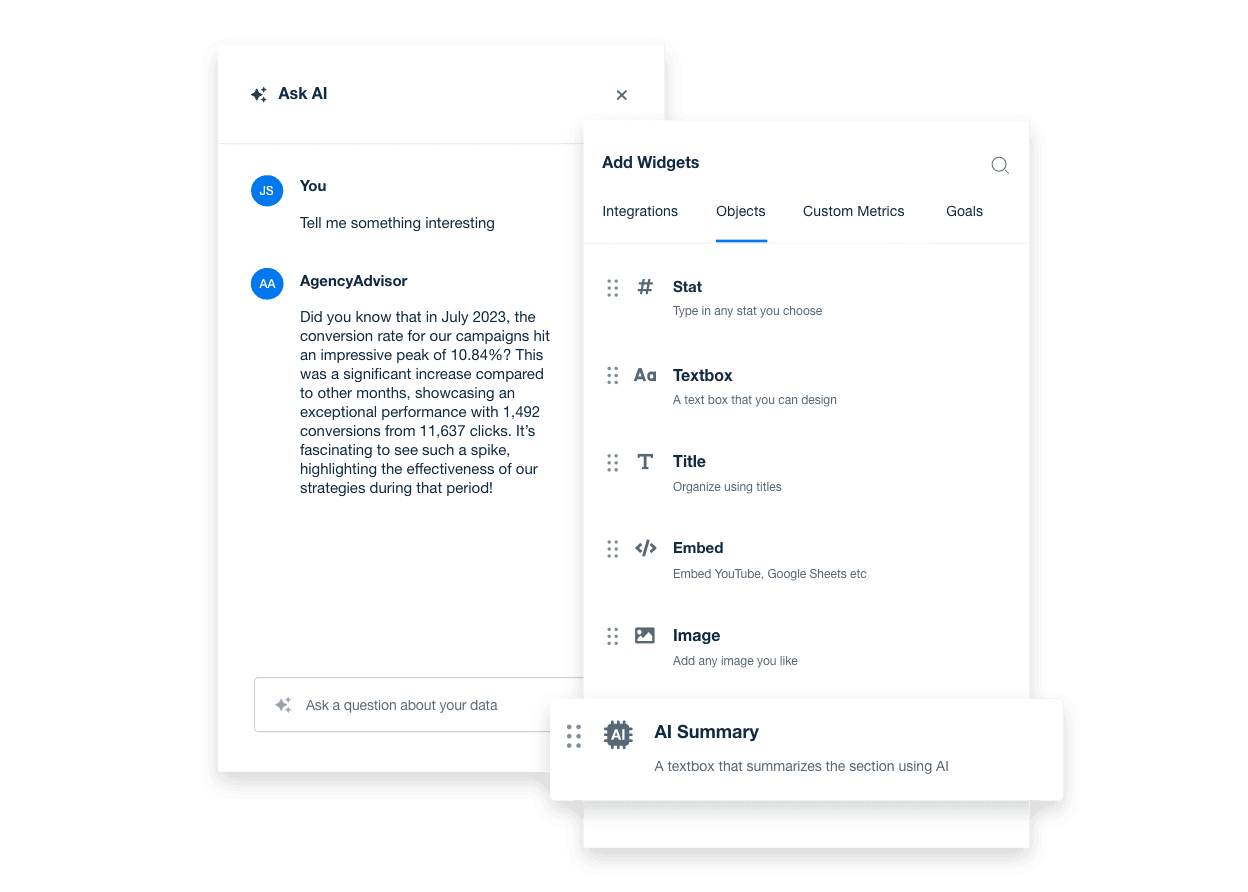
Spend less time sorting through Google Analytics dashboards and more time acting on what matters. With AI-powered reporting, surface key insights on traffic, conversions, and user behavior—fast.

Ask AI breaks down complex GA data into clear, client-ready takeaways. From top-performing pages to engagement trends, AI Summary delivers high-level overviews in seconds, keeping your team efficient and your clients in the loop.

Discover AI Reporting Tools
An example showing how to unlock powerful AI insights for real-time marketing decisions using AgencyAnalytics' AI reporting tools
Discover AI Reporting Tools
INDIVIDUAL ACCESS

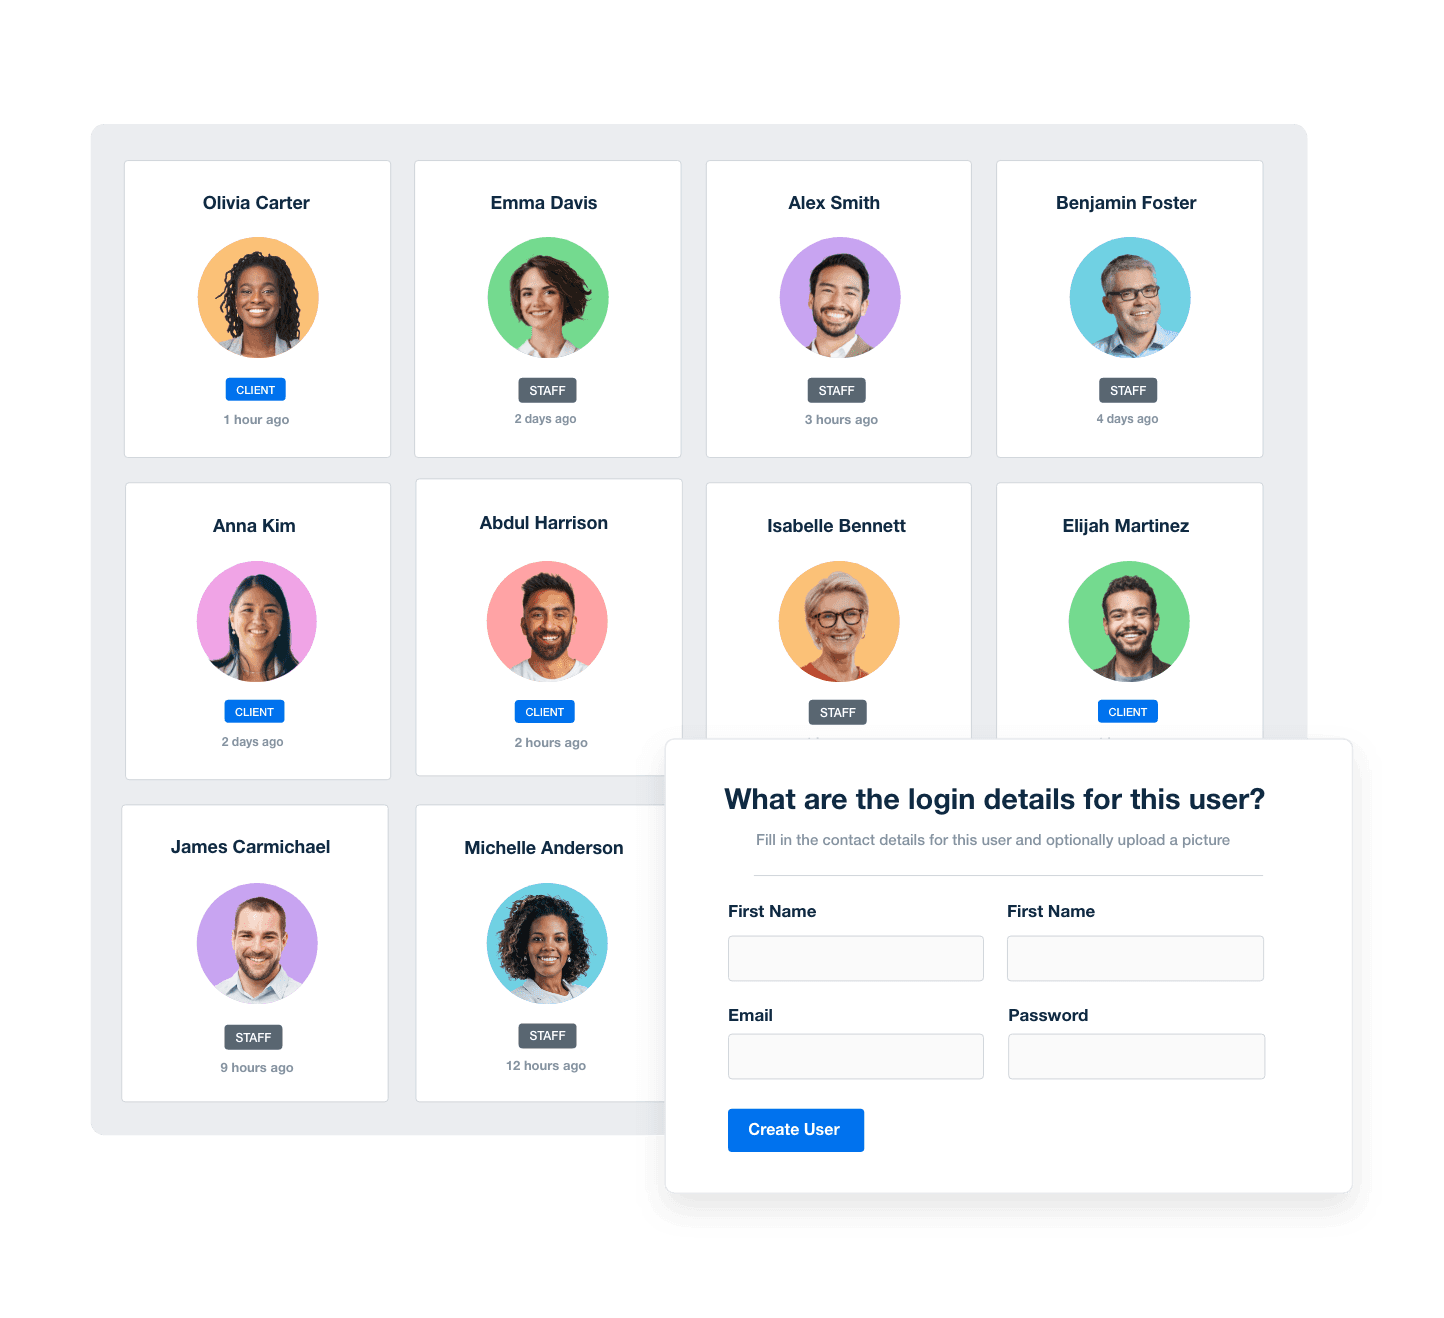
Unlimited Client & Staff Users for Full Agency Control

Manage your agency's workflows and keep everyone on the same page with a scalable reporting platform. Provide clients with a login for 24/7 access to custom dashboards to eliminate the back-and-forth emails between reporting periods.

Manage Your Entire Agency
Screenshot of AgencyAnalytic's staff and client management software
Manage Your Entire Agency
YOUR AGENCY'S BRANDING

White Labeled Google Analytics Reports

Put your agency's best colors on display. Select your logo, custom colors, and build reports that look like they were built in-house for that added level of professionalism.

Add Your Agency's Branding
An example of how to set up white labeled marketing agency reports and dashboards
Add Your Agency's Branding
Report Smarter. Not Harder.

Automate Reporting and Focus On What Matters

Streamline client reporting with a single, unified interface. Pull data from Google Analytics, Google Ads, Facebook, and 80+ marketing platform integrations into one clear report—no more switching between tools.

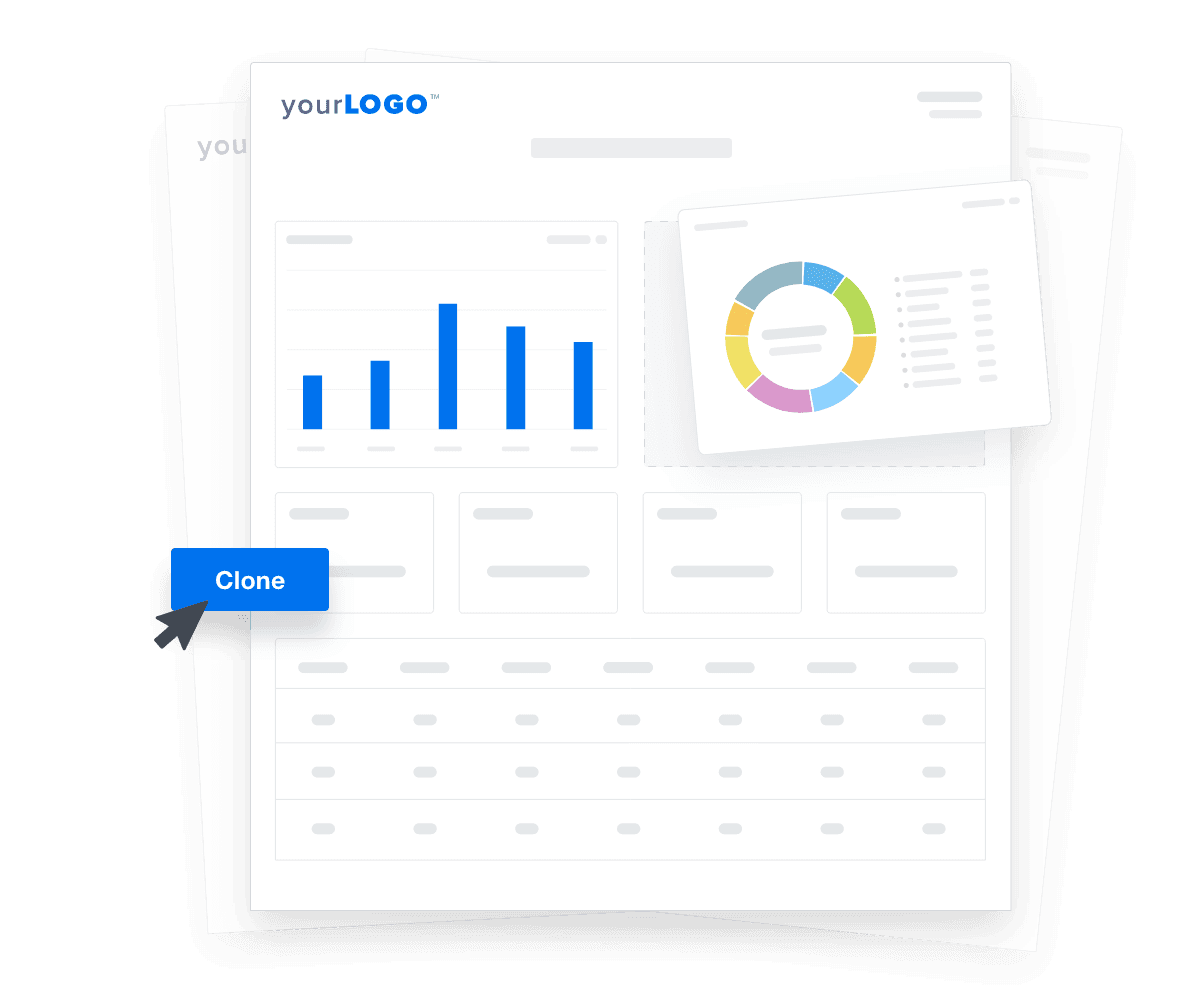
Customize templates for each client, duplicate them for new campaigns, and deliver consistent, professional reports in less time. Fast onboarding, effortless updates, and full visibility into marketing performance—all in one place.

Create Custom Dashboards
An illustration of cloning marketing reports and dashboards for faster client onboarding
Create Custom Dashboards

Sign up for your free trial now!

No credit card required. No setup hassle. Just instant access to automated reporting, custom dashboards, and multi-channel insights.

Start Your Free Trial
An icon showing a user clicking to start a free trial
Start Your Free Trial

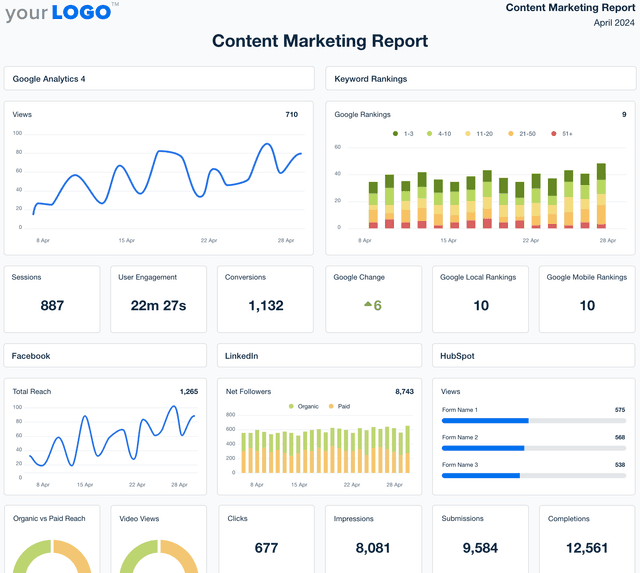
13 Sections Included in the Google Analytics Report Template

A professional, comprehensive web analytics report starts with a polished, sleekly-designed cover page. This personal touch solidifies your agency’s brand identity, demonstrates professionalism, and enhances your credibility–right from the start.

Plus, it helps clients see the insight in what you’re presenting in your weekly or monthly report, which helps your agency retain clients. It’s a way to maintain a professional image, show your attention to detail, and ensure clients understand the value of your work.

After creating a cover page, easily replicate it across other campaign performance reports to ensure brand recognition from all your clients.

For time-pressed clients, an executive summary cuts to the chase. This high-level overview presents the report’s takeaways, allowing managers and C-suite executives to quickly grasp the data and make informed decisions.

It’s also a springboard for other team members who want a summary before exploring in-depth information (e.g., a Social Media Analyst or an SEO Specialist).

Sessions represent the number of times users have opened your client’s website or app within a given time frame. Each session may include multiple page views, user interactions, and events.

While web traffic metrics don’t explicitly show how users interact with the content, it’s a good gauge of visibility and how much traffic was received.

A high number of sessions may indicate that you’re successfully creating campaigns that direct users to your client’s website or app.

Conversely, a low number of sessions may imply that your client’s marketing strategy needs improvements.

Total users represent the number of unique individuals who have visited your client’s website or app over a specific time period. This number is useful for understanding audience size and overall reach.

An increase in total users is a promising sign. It shows that your agency is successfully building brand awareness and generating interest from new users.

To address a stagnant or low number, focus on click-worthy links, building domain authority, and running paid ads to complement SEO efforts.

Engagement rate measures the percentage of users who interact meaningfully with your client’s website or app. This includes actions like clicking links, filling out a contact form, or watching a video.

A high engagement rate shows that your client’s content is piquing user interest. Plus, engaged, active users are also one step closer to a conversion (e.g., fulfilling ecommerce purchases from your client’s online store), so it’s definitely worth reporting on.

Conversely, a low engagement rate requires intervention. Some possible fixes include refining your client’s content strategy, including interactive elements (e.g., polls), and incorporating more calls to action.

The inverse of Engagement Rate, Bounce rate measures the percentage of visitors who leave your client’s web pages or app after viewing only one page. While it may not seem ideal, a marginal bounce rate is normal and should be expected.

This metric helps marketing agencies identify which pages need improvement. This may mean improving site content, reducing page load time, and resizing large media files.

Also, explore other issues that may affect the user experience (e.g., users may exit text-heavy blogs without sufficient headings or paragraphs). After rectifying these issues, monitor any changes in marketing performance. If your client has an intricate website, consider creating a separate “Pages Report” section for more in-depth analysis.

Item click-through rate (CTR) measures the effectiveness of product listings in driving user interactions. It is a metric that evaluates how often users click on an item in a product list to view more details or proceed with a purchase relative to the number of times the item list was viewed.

It’s one step further along the conversion funnel, demonstrating interest and the potential to complete ecommerce transactions.

A high item CTR shows that your client’s product positioning is effective and garnering traction. On the other hand, a low rate may mean their strategy needs tweaking.

If your client needs this level of granularity in their reports, easily add this metric to customize your Google Analytics report template.

Google Analytics 4 Report Template Cover Page Example

Build custom Google Analytics reports that deliver results

Save time and impress clients with a powerful, results-driven report template. Access the free Google Analytics report template today!

Preview the Template
Illustration of a user at a marketing agency trying the client reporting features from AgencyAnalytics
Preview the Template

If your client has an ecommerce site, the add-to-cart metric reflects how frequently users add items to their online shopping carts. This action shows purchase intent and is a vital part of the conversion process.

A high rate indicates strong user engagement, suggesting that your client’s products and pricing are appealing. Conversely, a low rate may signal issues such as poor product selection, higher-than-average pricing, or a compromised user experience.

To improve this issue, focus on high-quality product imagery, relevant descriptions, and competitive pricing. Also, ensure the checkout process isn’t excessively long or glitchy.

Transactions in GA4 represent the purchase events tracked within digital properties, such as websites or mobile apps. These events provide critical insights into the performance of eCommerce activities and help measure the success of your sales strategies.

Digging deeper, items purchased refer to the total number of products bought by users on an ecommerce site or app. Adding this metric to your client's GA-4 report template shows the relationship between marketing efforts and sales while also identifying your client’s most popular products.

Conversion rate (otherwise known as User Key Event Rate) measures the percentage of visitors who complete a desired action on your client’s website or app (e.g., making a purchase or signing up for a newsletter).

A high conversion rate is often the end goal for many clients, especially those with revenue, lead gen, or engagement targets. It also reflects your agency’s ability to turn passive visitors into leads or customers.

To address a low conversion rate, map the customer journey, identify low-performing pages, and address bottlenecks (e.g., reducing steps in the checkout process). Also, ensure there are clear calls to action and a strong value proposition.

For more granular insights, easily filter this data to show priority events, such as tracking white paper downloads or a newsletter signup.

Total revenue represents the amount of money generated from transactions on a website or app. Revenue metrics include all sales, taxes, shipping fees, and any other monetary transactions associated with purchases made by users.

Some of the most popular ways agencies use the metrics drop-down menu to customize report templates and segment revenue data include Average Purchase Revenue, Average Purchase Revenue Per User, and Average Revenue Per User.

When reviewing Google Analytics data, start by identifying which platforms or marketing campaigns are bringing the most users to your client’s website or app. This works similarly to the Channels report in GA and includes sources like organic search, paid search, direct traffic, referral traffic, social media (both organic and paid), email campaigns, and even video marketing efforts.

Understanding where traffic originates helps your agency prioritize what’s working. Use this data to improve targeting, reallocate ad spend, and double down on the channels delivering the highest impact. Whether it’s a boost in SEO performance or a paid campaign driving conversions, these insights support smarter decisions and stronger ROI.

Need a dedicated report for a specific channel like PPC or SEO? With customizable templates, you can build one in seconds.

Segmenting your Google Analytics property by demographic data helps reveal exactly who’s engaging with your client’s site. Similar to the audience overview in Universal Analytics, this section breaks down key characteristics like age, gender, language, and device usage—including how many visitors are on mobile, tablet, or desktop.

You’ll also get insight into operating systems (like Mac OS, Windows, or Android), browser types (such as Chrome or Firefox), and even user interests. These details help your agency fine-tune targeting, tailor messaging, and deliver campaigns that resonate with the right audience.

Google Analytics 4 Add to Cart

FAQs About Automated Google Analytics Report Templates

Still have questions about how to create and use automated Google Analytics Report Templates? Don’t worry, we’ve got you covered.

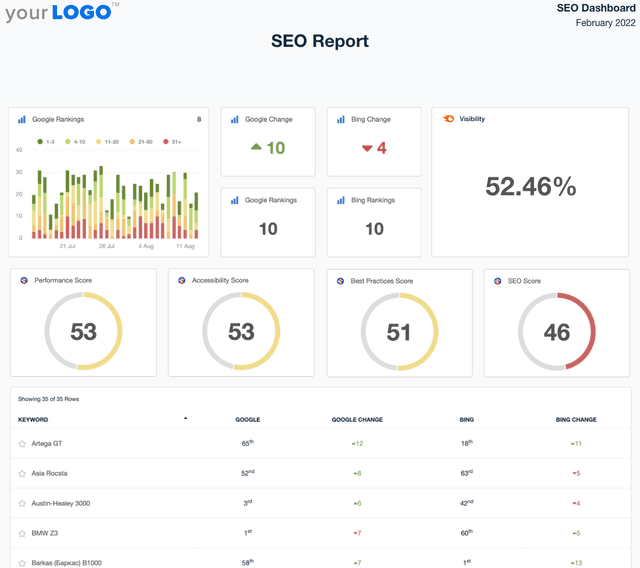
  • A Google Analytics report template is a pre-built framework that pulls website traffic data from your client’s Google Analytics dashboard into a client-friendly format. It helps digital marketers present key performance metrics and insights without starting from scratch. Combine this data into an SEO report template that connects with other SEO tools to showcase your client’s full online presence—or build a PPC report template that highlights paid advertising metrics to prove the impact of your agency’s campaigns.

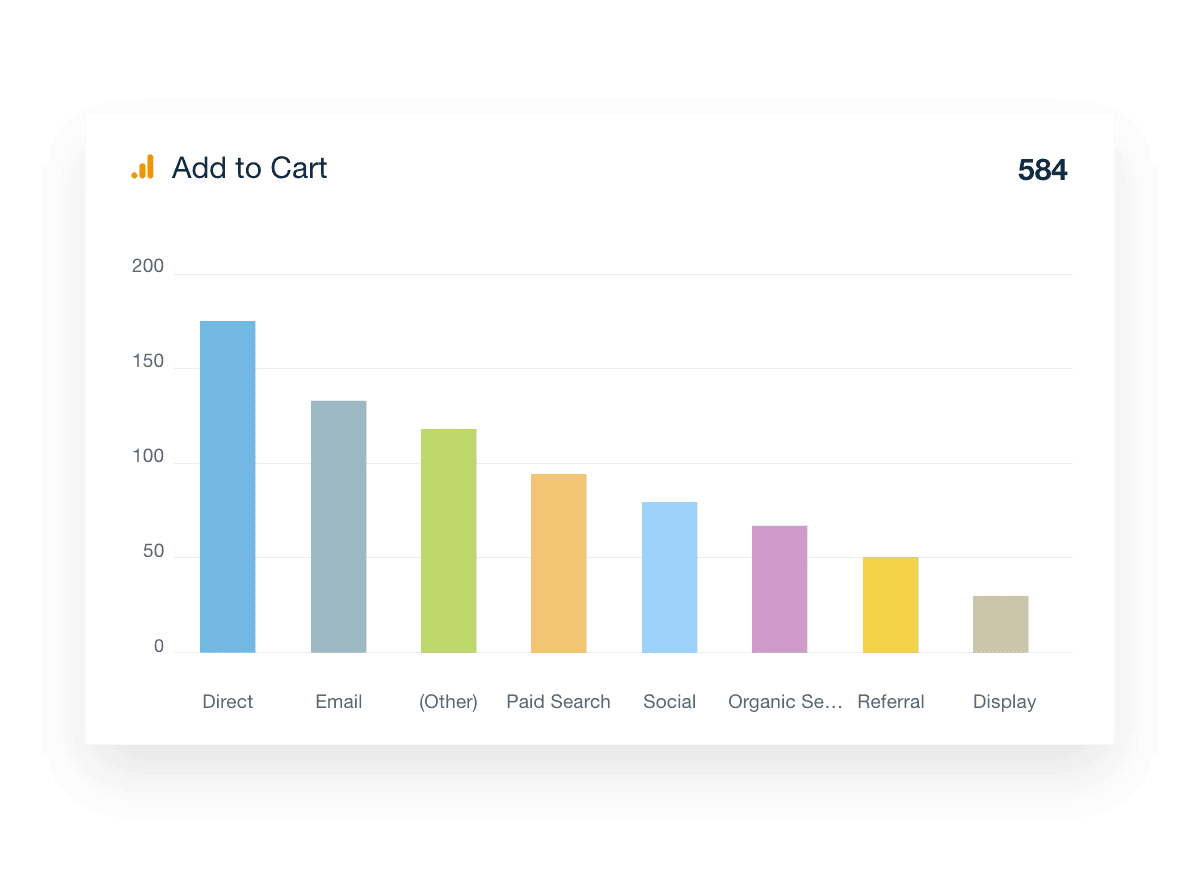
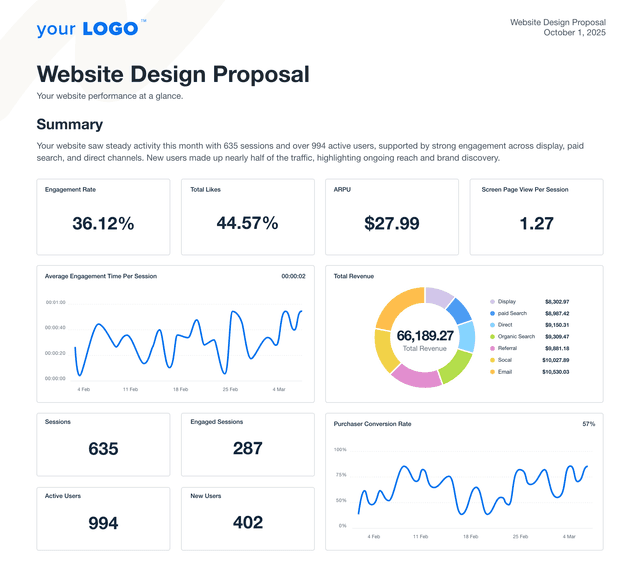
  • Key metrics include sessions, users, bounce rate, average session duration, events, and goal completions. You should also report on traffic sources such as paid search traffic, referral traffic, social media, and organic search traffic to show how different traffic sources contribute to your client’s goals. Including revenue metrics and top landing pages gives a clear view of what’s driving results.

  • Agencies automate Google Analytics reporting using AgencyAnalytics, a reporting tool that pulls all the data from your client’s Google Analytics dashboard. This automation works for any date range and eliminates the need to copy data into Google Sheets or Google Data Studio. It also makes it easy to create custom reports in minutes, saving valuable time.

  • A Google Analytics report reveals which traffic sources bring the most engaged users, how visitors interact with landing pages, and which channels drive conversions. By using custom reports, you get deeper insights into specific campaigns or audience behaviors without the heavy lifting. These insights help improve your client’s digital marketing efforts across all channels.

  • Google Analytics reports help by showing how SEO and other digital marketing strategies impact website traffic, engagement, and conversions. By including SEO, PPC, Social Media, and Email data alongside Google Analytics KPIs, agencies prove the value of their digital marketing efforts. Tracking paid search traffic, referral traffic, and search traffic helps optimize both paid and organic strategies.

  • Yes, you can fully customize Google Analytics reports using the drag-and-drop report and dashboard builder. Create custom reports for different client goals, or showing only the most relevant performance metrics. Whether you need to highlight landing pages, revenue metrics, or traffic sources, custom reports ensure every client sees the insights that matter to them.

  • Many agencies use the social media analytics report to present social media results. The SEO performance report provides detailed search data, while PPC outcomes are captured with the PPC monthly report template. For complete campaign summaries, agencies prefer the monthly digital marketing report template, and website engagement is reported through the website analytics report.

More templates

A screenshot of an example SEO Report template

SEO Report

Sending SEO reports shouldn’t mean spending your Friday night formatting screenshots in a PDF. Use a client-ready SEO report template to summarize rankings, traffic, backlinks, and key wins—then export and share in minutes.
Content marketing report template example

Content Marketing Report

Develop detailed content performance reports that emphasize critical metrics and deliver actionable insights. Utilize the customizable Content Marketing Report Template for efficient client communication, saving time for strategic content creation and optimization.
An example of a website design & development proposal template

Website Proposal

Present polished, persuasive proposals that win web design and development clients—without starting from scratch. This customizable website proposal template helps your agency communicate scope, timeline, and results to potential clients. Whether pitching a redesign or a brand-new build, the website proposal template is your shortcut to a more innovative sales process.
View All Templates

See how 7,000+ marketing agencies help clients win

Start Your Trial Now

Free 14-day trial. No credit card required.

Callout Get StartedSwoosh
Logo
G2 Users Love Us
AgencyAnalytics - G2 Leader Winter 2026
AgencyAnalytics - G2 Momentum Leader Winter 2026
G2 Crowd

4.7 out of 5

Capterra

4.8 out of 5

Product
Platform features
Agency solutions
Data integrations
Compare platforms
Reviews
Pricing
Company
About
Careers
Hiring
Media Kit
Contact
Get Started
Start Free Trial
Book a Demo
Quick Start Guide